[Report 1939] / Medical Officer of Health, Pembrokeshire County Council.
- Pembrokeshire (Wales). County Council.
- Date:
- 1939
Licence: Attribution 4.0 International (CC BY 4.0)
Credit: [Report 1939] / Medical Officer of Health, Pembrokeshire County Council. Source: Wellcome Collection.
9/44 (page 7)
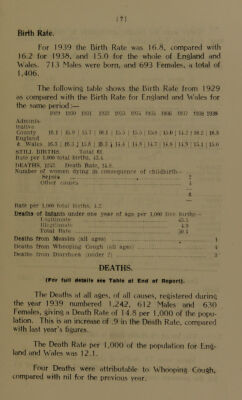
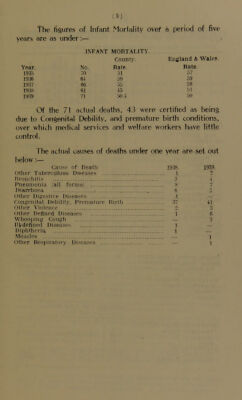
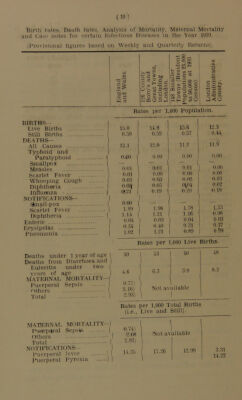
![Birth Rate. For 1939 the Birth Rate was 16.8, compared with 16.2 for 1938, and 15.0 for the whole of England and Wales. 713 Males were born, and 693 Females, a total of 1,406. The following table shows the Birth Rate from 1929 as compared with the Birth Rate for England and Wales for the same period :— 1929 1930 1931 1932 1933 1934 1935 1936 1937 1938 1939 Adminis- trative County 16.1S | 10.9 | 15.7 | 16.1 I 15.5 | 15.5 ] 15(8 | 15.0 | 14.2 |‘ 16.2 | 16.8 England & Wales 16.3 | 16.3 .ji 15.8 | 10.3 \ 14.4 | 14.8 | 14.7, | 14.8 | 14.9 [ 15.1 1 15.0 ST IIX BIRTHS. Total 61, Rate per 1,000 total births, 43.4. DEATHS, 1242. Death Rate, 14.8. Number of women dying in consequence of childbirth— Sepsla 2 Other causes 4 6 Rate per 1,000 total births, 4.2. Deaths of Infants under one year of age per 1,000 live births l.egitiniate 45.5 Illegitimate 4.9 Total Rate 50.4 Deaths from Measles (all ages) Deaths from Whooping Cough (all ages) Deaths from Diarrhoea (under 2) DEATHS. (For full details see Table at End of Report). The Deaths at all ages, of all causes, registered during the year 1939 numbered 1,242, 612 Males and 630 Females, giving a Death Rate of 14.8 per 1,000 of the popu- lation. This is an increase of .9 in the Death Rate, compared with last year’s figures. The Death Rate per 1,000 of the population for Eng- land and Wales was 12.1. Four Deaths were attributable to Whooping Cough, compared with nil for the previous year.](https://iiif.wellcomecollection.org/image/b28870396_0009.jp2/full/800%2C/0/default.jpg)