Annual report of the Board of Public Health Works, Bombay Presidency : 1938/39
- Bombay (India). Board of Public Health Works
- Date:
- 1939
Licence: Public Domain Mark
Credit: Annual report of the Board of Public Health Works, Bombay Presidency : 1938/39. Source: Wellcome Collection.
13/272 (page 3)
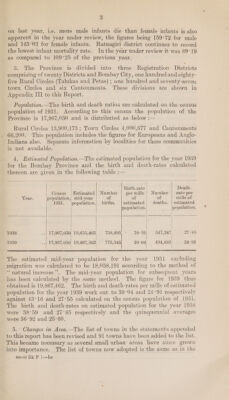
![on last year, ie. more male infants die than female infants is also - apparent in the year under review, the figures being 159°72 for male and 145°02 for female infants. Ratnagiri district continues to record the lowest infant mortality rate. Inthe year under review it was 89°19 as compared to 109°25 of the previous year. 3. The Province is divided into three Registration Districts comprising of twenty Districts and Bombay City, one hundred and eighty- five Rural Circles (Talukas and Petas); one hundred and seventy-seven. town Circles and six Cantonments. These divisions are shown in Appendix IIT to this Report. Population.—The birth and death ratios are calculated on the census population of 1931. According to this census the -population of the Province is 17,967,050 and is distributed as below :— Rural Circles 13,900,173 ; Town Circles 4,000,677 and Cantonments 66,200. This population includes the figures for Huropeans and Anglo- Indians also. Separate information by localities for these communities is not available. 4. Hstimated Population. —The estimated population for the year 1939 for the Bombay Province and the birth and death-rates calculated thereon are given in the following table :— | Birth-rate | Death- Census | Estimated| Number | per mille Number | rate per ‘Year. population, mid-year of of of mille of 1931. |population.| births. | estimated deaths. | estimated population. |population. | 1938 .| 17,967,050) 19,655,465, = 758 pees 38-59, 547,387 27°85 1939 -| 17,967,050) 19,867,562, 775, pas 39°04 494,887] 24°91 The estimated mid-year population for the year 1931 excluding migration was calculated to be 18,058,191 according to the method of “natural increase’. The mid-year population for subsequent years has been calculated by the same method. The figure for 1939 thus obtained is 19,867,462. The birth and death-rates per mille of estimated population for the year 1939 work out to 39°04 and 24°91 respectively against 43°16 and 27°55 calculated on the census population of 1931. The birth and death-rates on estimated population for the year 1938 were 38°59 and 27°85 respectively and the quinquennial averages were 36°92 and 25°60. 5. Changes in Area.—The list of towns in the statements appended to this report has been revised and 91 towns have been added to the list. This became necessary as several small urban areas have since grown into importance. The list of towns now adopted is the same as in the](https://iiif.wellcomecollection.org/image/b31847596_0013.jp2/full/800%2C/0/default.jpg)