Report of the Director-General of Public Health, New South Wales.
- New South Wales. Department of Public Health
- Date:
- [1926]
Licence: Public Domain Mark
Credit: Report of the Director-General of Public Health, New South Wales. Source: Wellcome Collection.
150/212 page 112
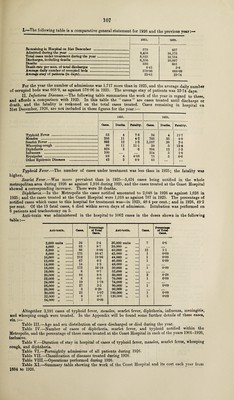
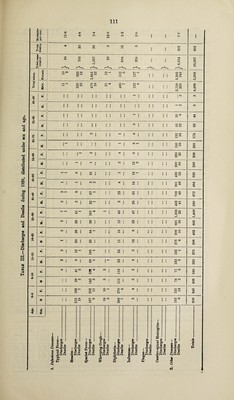
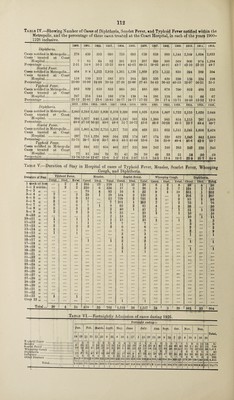
![Table IV.—Showing Number of Cases of Diphtheria, Scarlet Fever, and Typhoid Fever notified within the Metropolis, and the percentage of these cases treated at the Coast Hospital, in each of the years 1900- 1326 inclusive. 1900. 1901. 1902. 1903. 1904. 1905. 1906. 1907. 1908. 1909. 1910. 1911. 1912. Diphtheria. Cases notified in Metropolis... 278 439 393 690 738 095 C59 659 880 1,144 2,109 1,834 2,632 Cases ' treated at Coast Hospital. 7 65 64 92 301 313 267 389 360 500 909 974 1,284 Percentage . 2-51 14-8 16-3 13-33 40-8 45-03 40-51 59-03 40-91 43-7 43-10 53-10 48-7 Scarlet Fever. Cases notified in Metropolis... 464 8:4 1,253 2,910 1,361 1,136 1,869 976 1,153 836 394 369 304 Cases treated at Coast Hospital. 116 150 313 585 371 284 593 336 420 339 150 134 108 Percentage . 25-00 16-96 24-98 20-10 27-26 25-00 27-45 34-43 36-43 40-55 38-07 36-31 35-5 Typhoid Fever. Cases notified in Metropolis... 983 829 610 833 665 561 485 505 678 700 812 488 535 Cases treated at Coast Hospital. 247 214 144 166 178 139 84 101 118 96 85 66 67 Percentage . 25-12 25-81 23-6 19-93 26-77 24-77 17-32 20 17-4 13-71 10-46 13-52 12-5 1913. ] 1914. 1915. 1916. 1917. 1918. 1919. 1920. 1921. I 1922. 1923. 1924. 1925. 1926. Diphther id( Cases notified in Metropolis... 2,045 2,244 2,551 2,829 2,576 2,399 988 1,825 2,916 1,807 1,722 2,115 1,626 2,048 Cases treated at Coast Hospital. 994 1,057 940 1,149 1,259 1,241 501 834 1,360 905 854 1,115 787 1,018 Percentage. 48-6 47-10 36-85 40-6 48-8 51- 7 50-72 45-6 46-6 50-00 49-5 52-7 48-4 49-7 Scarlet Fever. Cases notified in Metropolis... 555 1,801 4,726 2,715 1,217 765 424 468 511 653 1,541 2,241 1,916 3,424 Cases treated at Coast Hospital. 287 715 1,224 968 564 333 174 167 174 229 622 1,045 842 1,668 Percentage. 51-71 39-7 25-9 35-7 46-3 43-5 41-04 35-6 34 35-0 40-4 46-6 43-9 48-7 Typhoid Fever. Cases notified in Metropolis 566 644 821 654 403 327 335 366 342 246 265 242 230 245 Cases treated at Coast Hospital. 77 81 104 79 21 41 20 56 49 33 51 68 50 GO Percentage. 13-78 12-58 12-67 12-0 5-2 12-5 5-97 15-3 14-3 13-4 19-2 23-9 21-7 24-4 Iable V. Duration of btay in Hospital of cases of Typhoid Fever, Measles, Scarlet Fever, Whooping Duration of Stay. Typhoid Fever. I Cured. | Died. I Total. 1 week or Jess ... 2 2 1— 2 weeks.. ... 2 2 2— 3 PP ... • * • • •• 3— 4 PP ••• 2 ... 2 4— 6 py 3 ... 3 5— 6 pp 5 5 6— 7 pp 6 6 7— 8 pp 5 5 S— 9 pp ••• 2 2 9—10 pp ... 10—11 pp 1 i 11—12 pp ••• i 1 12—13 pp ••• 2 ... 2 13—14 pp 1 ... 1 14—15 pp ••• 1 1 15—16 ... 16—17 ... 17—18 pp ... 18—19 ... 19—20 pp ... 20—21 ... 21—22 pp ... 22—23 ... 23—24 ... 24—25 ... 25—26 ... 26—27 27—28 28—29 pp 29—30 pp ... 30—31 pp ••• ... 31—32 pp ... 32—33 pp ••• 1 1 Over 33 pp • • • ... ... Total... 30 4 34 670 35 1 705 1 1,519 38 1,557 34 Measles. Scarlet Fever. Whooping Cough. Cured. Died. Total. Cured. Died. 1 Total. Cured. Died. Total. 195 23 218 11 15 26 6 2 8 330 6 336 17 9 26 5 2 7 79 4 83 16 6 22 9 1 10 28 i 29 154 2 156 3 3 12 • •• 12 729 2 731 2 2 7 7 391 1 392 2 2 7 i 8 63 2 65 4 4 2 2 40 1 41 1 1 3 3 33 33 i 1 2 2 18 18 1 1 15 15 i 1 1 1 7 7 2 2 6 6 ... ... 5 5 ... •. • ... 3 3 ... ... 4 4 1 •. • 1 2 2 ... . • • ... 1 1 ... . • • • • . 2 2 ••• ... ... 1 1 ... • •• ... ... ... ... ... ... — ... i i ... Diphtheria. Cured. | Died. ) Total. 39 26 4 30 134 1 135 351 1 352 204 3 207 95 1 96 75 1 76 36 ... 36 21 1 22 16 ... 16 10 1 11 3 ... 3 3 ... 3 2 ... 2 2 2 1 ... 1 ... ... • . • 1 ... 1 ... ... ... 1 ... 1 ... ... ... ... ... v* ... ... ... ... ... ••• ... ... ••• ... ... ... ... ... ... ... ... ... ... •y ... ... ... • • • ... ••• ... ... ... ... ... ... ... ... ... 981 13 994 Table VI.—Fortnightly Admission of cases during 1926. Fortnight ending— Jan. Feb. March. April. May. June July. Aug. Sept. Oct. Jfov. Dec. Total, 14 28 n 25 11 25 8 22 6 20 3 | 17 1 15 29 12 26 9 23 •7 21 4 18 2 16 31 Measles . Scarlet Fever . Whopping Cough . Diphtheria ....' influenza. Other Diseases Total. —t-—- 3f 40 £8 ' 5 214 1 21 •16 2 35 3 238 2 11 62 T9 £ 2G8 3 9 37 47 8 230 1 12 54 i'-’ 4 269 2 29 47 2 42 ' 256 3 11 50 69 e 238 2 16 50 2 62 5 243 3 14 93 50 13 284 1 1! 5 57 14 235 1 1 13 10 83 52 69 4 44 3, 225 214 1 1 H1 14 52 55 3 2 471 26 2l| £ 234 226 1 2 29 54 45 234 1 4; 52 28 4 238 2 64 57 3 28 249 1 f-7 62 3 47 8 254 1 46 56 30 7 254 1 40 65 25 e 239 1 43 102 2 32 2 23' 1 29 85 3 20 2 279 3 24 78 2 33 3 263 5 31 56 2 20 7 243 12 21 132 6 35 6 246 13 12 98 5 £0 2 193 67 700 1,671 40 1,017 235 6,445 330 395 270 384 38-i 383 377 350 457 380 437 356 366 332 1 371 871 403 462394 1 378 420 419412 369 458 353 10,175](https://iiif.wellcomecollection.org/image/b31485170_0150.jp2/full/800%2C/0/default.jpg)