Training to reason : an investigation into the possibility of training in seeing relations of evidence / by Marjorie Hill.
- Marjorie Hill Allee
- Date:
- 1936
Licence: In copyright
Credit: Training to reason : an investigation into the possibility of training in seeing relations of evidence / by Marjorie Hill. Source: Wellcome Collection.
35/76 (page 33)
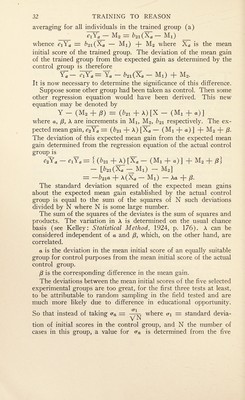
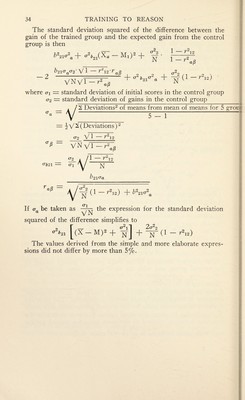
![initial mean scores for the five selected groups. This is a fairer assumption and does take some account of the variability of educa¬ tional status in the different groups. This stretching of the distri¬ bution of as leads to a higher correlation between a and /?-—taking the standard deviation of an array of p’s corresponding to a par¬ ticular value of a to be constant and equal to y 1 — r212 where r12 is the correlation between the initial scores and gain for the control group. The regression line of p’s on as is given by ft — b2ia so that the correlation surface of as and p’s is — (P — b21a)2 ■a z = Whence o- = 1 2 a2 ^7raa ** array /Ts q~ array ft array jS’s 2(72 a (T 2 Vl r212 0 VI —r2 a VN yi —r<i a/3 /^/§(l - r*u) + **»«*„ Reverting to the expression for the standard deviation squared of the expected gains from the expected gain determined by the control group, the average of the squares and products with the variations in a, p and A limited as above is Mi)2 + — • 1 ~ r2]2 ' N 1 -r2 6*iio*a +o*»sl-(Xs 2b2l <Ja‘ (T2 V 1 — r212-f aj3 VN\/1 — r\p The standard deviation of the mean gains of groups similar to the control group and with the same initial mean score is v 2 VN vi r212 If the mean score of the control group had been Xa the standard deviation of mean gains would be about the same. The standard deviation of the mean gains for the trained groups each with mean Xa would also be about the same value. We may then take the standard deviation squared of the mean gains for trained groups O’2 2 each with initial mean Xa as tt (1 N v . y2 12 ). c](https://iiif.wellcomecollection.org/image/b29932063_0035.jp2/full/800%2C/0/default.jpg)