Annual report of the Director of Public Health for the Government of Bombay.
- Bombay (India : State). Public Health Department.
- Date:
- [1941]
Licence: Public Domain Mark
Credit: Annual report of the Director of Public Health for the Government of Bombay. Source: Wellcome Collection.
17/260 (page 7)
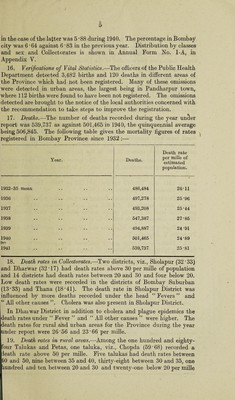
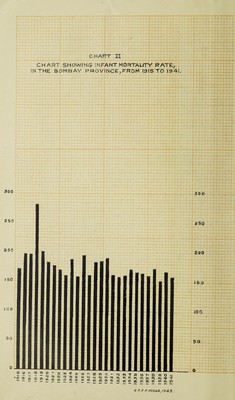
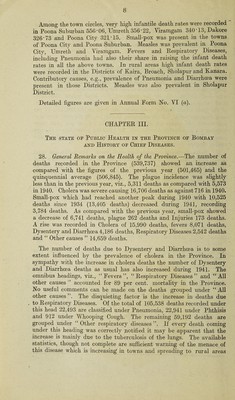
![f Graphs showing the incidence of deaths under the chief causes for the year under report compared with previous years are shown in Charts I and IY. Graphs showing the annual incidence of deaths under the epidemic diseases, Cholera, Small-pox and Plague are shown in Chart VII. Infant Mortality. 26. Deaths under one year have fallen from 128,103 in 1940 to 121,298 in 1941, the ratio per one thousand of births being 169’36 and 158 ‘95 respectively. Male infant deaths exceeded the female infant deaths in almost all the localities except for a few towns. Of the infants who died 48,730, i.e., 40 per cent, of the total infant mortality, died before they were one month old, 27,638 of these, i.e., 23 per cent, of the total infant deaths, were under one week and 21,092, i.e., 17 per cent, over one week. Of the remaining 41,598, i.e., 34 per cent, were over one month and under six months and 30,970, i.e., 26 per cent, were between six and twelve months old. In 1940 the percentage in the age groups of under one month, between one and six months and six and twelve months were 37, 36 and 27, respectively. 27. Infant mortality in urban and rural areas.-—The urban and rural infant death rates per 1,000 registered births for the Province were 192’22 and 149*76, respectively, as compared with 202’45 and 160*13 in the previous year. Infant mortality in 1941 as compared with previous years is shown in the table below :■— Year. Deaths under 12 months. Births registered. Infant death-rate per 1,000 births. Infant deaths per 100 Male. Female. Total. Male. Female. Total. Male. Female. Total. of total deaths. 1916-20 mean. 64,131 1 55,719 119,850 291,606 274,110 565,716 219-93 203-27 211-86 15-92 1921-25 54,635 46,147 100,782 301,679 282,575 584,254 181-10 163*31 172-50 23-09 mean. 1926-30 64,088 54,286 118,374 330,921 311,953 642,874 193-67 174-02 184-13 24-62 mean. 1931-35 mean. 64,045 53,842 117,887 366,082 344,345 710,427 174*95 156-36 165*94 24-37 1936 67,226 56,063 123,289 382,054 360,277 742,331 175*96 155-61 166-08 24-79 1937 63,248 54,010 117,258 376,426 353,050 729,470 168-02 152-98 160*74 23-77 1938 71,532 60,568 132,100 389,622 368,873 758,495 183*59 164*20 174-16 24-13 1939 63,838 54,587 118,425 399,681 375,864 775,545 159-72 145-02 152-70 15-27 ] 940 68,688 59,415 128,103 389,316 866,501 755,817 176-43 162-11 169*36 25*54 1941 65,505 55,793 121,298 393,411 369,701 763,112 • 166-50 150-91 158-95 22-47](https://iiif.wellcomecollection.org/image/b3140537x_0017.jp2/full/800%2C/0/default.jpg)