[Report of the Medical Officer of Health for Lewisham].
- Lewisham (London, England). Board of Works.
- Date:
- 1874
Licence: Attribution-NonCommercial 4.0 International (CC BY-NC 4.0)
Credit: [Report of the Medical Officer of Health for Lewisham]. Source: Wellcome Collection.
Provider: City of London, London Metropolitan Archives
5/69
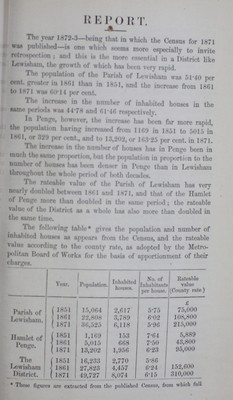
![REPORT. The year 1872-3—being that in which the Census for 1871 was published—is one which seems more especially to invite retrospection; and this is the more essential in a District like Lewisham, the growth of which has been very rapid. The population of the Parish of Lewisham was 51.40 per cent. greater in 1861 than in 1851, and the increase from 1861 to 1871 was 60.14 per cent. The increase in the number of inhabited houses in the same periods was 44.78 and 61.46 respectively. In Penge, however, the increase has been far more rapid, the population having increased from 1169 in 1851 to 5015 in 1861, or 329 per cent., and to 13,202, or 163.25 per cent. in 1871. The increase in the number of houses has in Penge been in much the same proportion, but the population in proportion to the number of houses has been denser in Penge than in Lewisham throughout the whole period of both decades. The rateable value of the Parish of Lewisham has very nearly doubled between 1861 and 1871, and that of the Hamlet of Penge more than doubled in the same period; the rateable value of the District as a whole has also more than doubled in the same time. The following table* gives the population and number of inhabited houses as appears from the Census, and the rateable value according to the county rate, as adopted by the Metro Politan Board of Works for the basis of apportionment of their charges. Year. Population Inhabited houses. No. of Inhabitants per house. ble value (County rate ) Parish of Lewisham. £ 1851 15,064 2,617 5.75 75,000 1861 22,808 3,789 6.02 108,800 1871 36,525 6,118 5.96 215,000 Hamlet of Penge. 1851 1,169 153 7.64 5,889 1861 5,015 668 7.50 43,800 1871 13,202 1,958 6.23 95,000 The Lewisham District. ( 1851 16,233 2,770 5.86 ] 1861 27,823 4,457 6.24 152,600 1871 1 49,727 8,074 6.15 310,000 * These figures are extracted from the published Census, from which full](https://iiif.wellcomecollection.org/image/b19954451_0005.jp2/full/800%2C/0/default.jpg)