Statistics of fever and small-pox in Glasgow. Read to the Statistical Society of Glasgow, April 28, 1837 / [Robert Cowan].
- Robert Cowan
- Date:
- 1837
Licence: Public Domain Mark
Credit: Statistics of fever and small-pox in Glasgow. Read to the Statistical Society of Glasgow, April 28, 1837 / [Robert Cowan]. Source: Wellcome Collection.
23/40 page 19
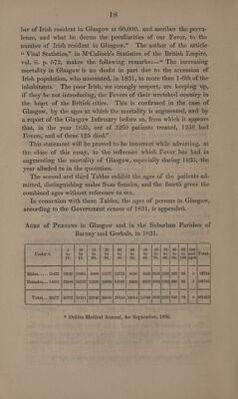
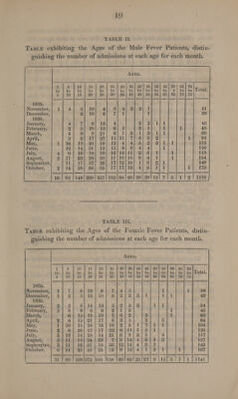
![TABLE II. TasiEe exhibiting the Ages of the Male Fever Patients, distin- guishing the number of admissions at each age for each month. 5 | 10 | 15 | 20 | 25 | 30} 35] 40] 45] 50] 55] 60] 65} 70 to | to | to | to | to | to| to] to] to] to} to} o| to} to |Total. 10 | 15 | 20 | 25 | 30 | 35] 40] 45| 50] 55] 60] 65] 70] 75 1835. November, 10 4} 3} 2] 1 Al December, 1 30 1836. January, 2| 2 43 February, aS | 43 March, 1] 3 60 April, 6| 3 94 May, 5| 2 113 June, 4} 4 110 July, 3/ 6 115 August, 9| 4 154 September, 1] 6 140 October, 4| 6 173 1116 TABLE Ill. TaBLeE exhibiting the Ages of the Female Fever Patients, distin- guishing the number of admissions at each age for each month. AGES. 1 5 10 5 | 30} 35} 40] 45] 50] 55] 60! 65} 70 to | to | to to| to| to} to| to| to] to} to} to} Total. 5 10 15 35} 40] 45] 50] 55} 60] 65 | 70] 75 1835. November,| 1 7 6 1 58 December,} 1 | 2 5 49 1836. January, 21.2 6 2/5 54 February, 3] 8 9 1/3 43 March, 6} 18 6 | 2 2 63 April, 2; 8] 15 3] 5 2 84 May, 1} 10] 15 2/5 7 104 June, 2) 8] 26 6 | 1) 5 126 July, 5 | 12] 14 6|9 l 117 August, 5] 11} 18 6 |14 5 127 September,} 3 | 11] 19 13) 14 3 149 October, 6) 141] 23 9]12 1 167 eS —-—— | — —| — - | — | —— — | — — |] —— | — | —— 31 | 99 | 169/272 1188 1158 160185) 23/27) 9 | 15| 3](https://iiif.wellcomecollection.org/image/b33285548_0023.jp2/full/800%2C/0/default.jpg)