Report on the public health of Finsbury 1909 including annual report on factories and workshops.
- Finsbury (London, England). Metropolitan Borough.
- Date:
- 1910
Licence: Attribution-NonCommercial 4.0 International (CC BY-NC 4.0)
Credit: Report on the public health of Finsbury 1909 including annual report on factories and workshops. Source: Wellcome Collection.
26/142 page 24
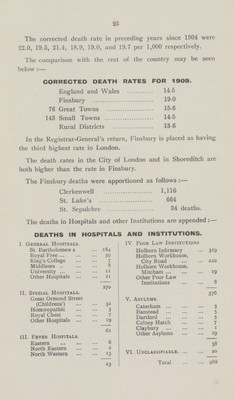
![24 DEATHS AND DEATH RATES. The number of Finsbury residents who died in 1909 was 1,814, equivalent to a crude death rate for the whole Borough of 19 0 per 1,000 inhabitants living. The death rate for the whole of London was 14.03 per 1,000, as compared with 14.0 and 14.6 in 1908 and 1907 respectively. CRUDE DEATH RATES. ]The Borough. North Clerkenwell. South Clerkenwell. St. Luke. St. Sepulchere. 1901 21.4 20.0 20.3 23.7 18.8 1902 22.7 22.3 20.7 24.3 20.1 1903 19.8 19.2 18.3 21.7 19.0 1904 21.1 21.7 18.9 22.0 23.0 1905 18.9 18.5 17.3 20.2 25.2 1906 20.7 22.7 18.6 20.3 24.7 1907 18.3 I7.5 l6.4 20.3 24.9 1908 18.4 18.3 18.9 10.3 1909 19.0 18.5 19.9 20.7 In comparing one district with another it is important to take into account the number of males and females in both, the number of young people, and the number of old people. All these have different death rates. A district with a large number of infants and a large number of old people will have a higher death rate than one in which the inhabitants are chiefly young adults. In order to overcome the difficulty thus arising—the Registrar General has calculated a factor for correction for each district— which when multiplied into the crude death rate gives the ''corrected'' death rate available for comparison with the rates in other districts. The factor for correction in Finsbury is 1 0355. This multiplied into 19.0 the crude death rate gives a corrected death rate of 19.7 per 1,000.](https://iiif.wellcomecollection.org/image/b18108921_0026.jp2/full/800%2C/0/default.jpg)