Report of the Reorganisation Commission for fat stock for England and Wales.
- Great Britain. Agricultural Marketing Reorganisation Commission.
- Date:
- 1934
Licence: Public Domain Mark
Credit: Report of the Reorganisation Commission for fat stock for England and Wales. Source: Wellcome Collection.
28/162 (page 10)
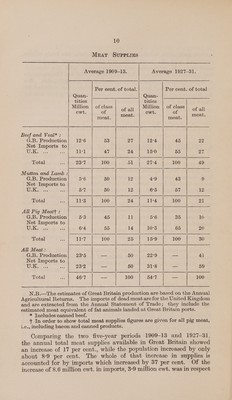
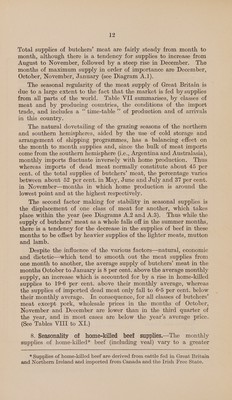
![Meat SvUPPLies Average 1909-13. Average 1927-31. Per cent. of total. Per cent. of total Quint )| Pr ton) > ee A Oan tities tities Million | of class Million | of class cwt. of of me cwt. of ins meat. sae meat. : | Beef and Veal* : | G.B. Production 12°6 53 JAG 12°4 45 As Net Imports to U.KRieess oe Ill 47 24 15:0 55 rag Total 44 23°7 100 51 Ag i. Ree 100 49 Mutton and Lamb : G.B. Production 5°6 50 12 4°9 43 9 Net Imports to UKs ae 57 50 12 6°5 57 12 Total a ible) 100 24 11°4 100 al All Pig Meatt : G.B. Production 53 45 11 5'6 35 16 Net Imports to 9 Sia gaa co 6°4 55 14 10°3 65 20 Total - 11°7 100 25 15°9 100 30 All Meat: G.B. Production 23°5 — 50 22°9 — 4] Net Imports to a Giped eee 232, — 50 31°8 — 59 Total = 46°7 — 100 54:7 — 100 N.B.—The estimates of Great Britain production are based on the Annual Agricultural Returns. The imports of dead meat are for the United Kingdom and are extracted from the Annual Statement of Trade; they include the estimated meat equivalent of fat animals landed at Great Britain ports. * Includes canned beef. + In order to show total meat supplies figures are given for all pig meat, i.e., including bacon and canned products. Comparing the two five-year periods 1909-13 and 1927-31, the annual total meat supplies available in Great Britain showed an increase of 17 per cent., while the population increased by only about 89 per cent. The whole of that increase in supplies is accounted for by imports which increased by 37 per cent. Of the increase of 8.6 million cwt. in imports, 3-9 million ewt. was in respect](https://iiif.wellcomecollection.org/image/b32177884_0028.jp2/full/800%2C/0/default.jpg)