[Report of the Medical Officer of Health for London County Council 1911].
- London County Council (London, England). County of London.
- Date:
- [1913]
Licence: Attribution-NonCommercial 4.0 International (CC BY-NC 4.0)
Credit: [Report of the Medical Officer of Health for London County Council 1911]. Source: Wellcome Collection.
15/309
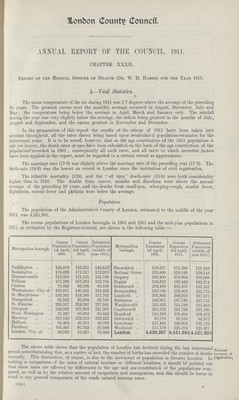
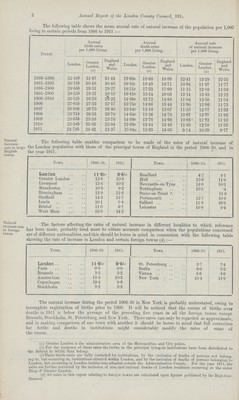
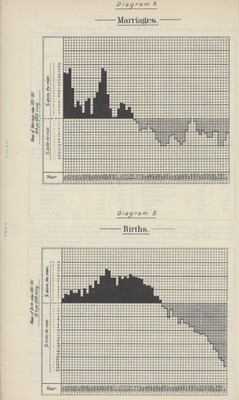
![London County Council. ANNUAL REPORT OF THE COUNCIL, 1911. CHAPTER XXXII. Report of the Medical Officer of Health (Dr. W. H. Hamer) for the Year 1911. A—Vital Statistics. The mean temperature of the air during 1911 was 1:7degrees above the average of the preceding 65 years. The greatest excess over the monthly average occurred in August, December, July and May; the temperature being below the average in April, March and January only. The rainfall during the year was very slightly below the average, the deficit being greatest in the months of July, August and September, and the excess greatest in November and December. In the preparation of this report the results of the census of 1911 have been taken into account throughout, all the rates shown being based upon recalculated population-estimates for the intercensal years. It is to be noted, however, that as the age constitution of the 1911 population is not yet known, the death rates at ages have been calculated on the basis of the age constitution of the population* recorded in 1901; consequently all such rates, and all rates to which corrective factors have been applied in the report, must be regarded to a certain extent as approximate. The marriage rate (17.8) was slightly above the marriage rate of the preceding year (17.3). The birth-rate (24.8) was the lowest on record in London since the institution of civil registration. The infantile mortality (129), and the all ages death-rate (15.0) were both considerably higher than in 1910. The deaths from cancer, measles and diarrhoea were above the annual average of the preceding 10 years, and the deaths from small-pox, whooping-cough, scarlet fever, diphtheria, enteric fever and phthisis were below the average. Population. The population of the Administrative County of London, estimated to the middle of the year 1911, was 4,521,301. % The census populations of London boroughs in 1901 and 1911 and the mid-year populations in 1911, as estimated by the Registrar-General, are shown in the following table :— Metropolitan borough. Census Population 1st April, 1901. Census Population 3rd April, 1911. Estimated Population (middle of year 1911). Metropolitan borough. Census Population 1st April, 1901. Census Population 3rd April, 1911. Estimated Population (middle of year 1911). Paddington 143,976 142,551 142,513] Shoreditch 118,637 111,390 111,199 Kensington 176,628 172,317 172,203 Bethnal Green 129,680 128,183 128,144 Hammersmith 112,239 121,521 121,766 Stepney 298,600 279,804 279,309 Fulham 137,289 153,284 153,705 Poplar 168,822 162,442 162,274 Chelsea 73,842 66,385 66,189 Southwark 206,180 191,907 191,531 Westminster City of 183,011 160,261 159,662 Bermondsey 130,760 125,903 125,775 St. Marvlebone 133,301 118,160 117,761 w Lambeth 301,895 298,058 297,957 Hampstead 81,942 85,495 85,589 Battersea 168,907 167,743 167,712 St. Pancras 235,317 218,387 217,941 Wandsworth 231,922 311,360 313,453 Islington 334,991 327,403 327,203 Camberwell 259,339 261,328 261,380 Stoke Newington 51,247 50,659 50,644 Deptford 110,398 109,496 109,472 Hackney 219,110 222,533 222,623 Greenwich 95,770 95,968 95,973 Holborn 59,405 49,357 49,092 Lewisham 127,495 160,834 161,712 Finsbury 101,463 87,923 87,566 Woolwich 117,178 121,376 121,487 London, City of 26,923 19,657 19,466 London 4,536,267 4,521,685 4,521,301 Natural increase of popt^ation. The above table shows that the population of London has declined during the last intercensal period notwithstanding that, as a matter of fact, the number of births has exceeded the number of deaths annually. This diminution, of course, is due to the increment of population in Greater London. In making a comparison of the rates of natural increase in different localities, it should be pointed out that these rates are affected by differences in the age and sex-constitution of the populations com pared, as well as by the relative amount of emigration and immigration, and this should be borne in mind in any general comparison of the crude natural increase rates. 12532](https://iiif.wellcomecollection.org/image/b18252606_0015.jp2/full/800%2C/0/default.jpg)

 No text description is available for this image
 No text description is available for this image
 No text description is available for this image