The action of the Health Department in relation to pulmonary tuberculosis and the scope and purpose of the measures recently adopted for its prevention : a report of the Board of Health of the City of New York to Hon. William L. Strong, Mayor of the City of New York.
- New York (N.Y.). Board of Health
- Date:
- 1897
Licence: Public Domain Mark
Credit: The action of the Health Department in relation to pulmonary tuberculosis and the scope and purpose of the measures recently adopted for its prevention : a report of the Board of Health of the City of New York to Hon. William L. Strong, Mayor of the City of New York. Source: Wellcome Collection.
Provider: This material has been provided by The Royal College of Surgeons of England. The original may be consulted at The Royal College of Surgeons of England.
53/76 page 49
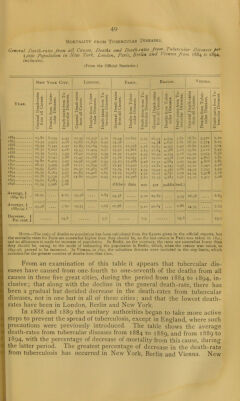
![Mortality from Tubercular Diseases. General Death-rates from all Causes. Deaths and Death-rates from Tubercular Diseases per 1,000 Population in New York, London, Paris, Berlin and Vienna from 1884 to 1894, inclusive. (From the Official Statistics.) Year. New York City. go r\ _ <u u, c 3 o H « H 0) 6 rt o mP <t> , cc <y (S-° London. P^ ■a ^ s I § th O H S e 8 V) ^ x: * r, in r* a) S 01 c3 ^2 *r 3 ^ a o Bo> «/l JSS S 5 Q c ^ S 03 O OJ «3 Ctf 0) 3-° Berlin. ■S S « « o O H ! S ! 2 » t— 4, _ l/, e « P Vienna. UJ <D etf c/> u a 0 . ^3 tn 3 • H5 3 9i C ai j= 3 0 CJ rf « <u _) r* ° E Rs °r> ■ rt rt 2S 3 S 3: £ rt § 0 ] 0 p p p 1884 25.82 6,039 4.45 20.39 I2,537 3.12 25-44 11,625 5-19 26.33 4,534 3.62 26.80 5,47° 1885 25-55 5,953 4.26 19.67 11,850 2.90 24.38 24.38 4,657 3.61 28.50 5.574 1886 25-99 6,349 4.42 19.89 12,164 2-93 25-25 12,258 5-56 25.63 4,547 3-4° 26.60 5,525 1887 26.32 6,007 4.06 19-53 11,424 2.71 23.92 II,8l8 5-15 2I.84 4.388 3.16 25.80 5,110 23-39 6,°73 3-99 18.42 10,929 2-54 22.92 11,472 4-93 20.30 4.554 3.16 25.20 5i°54 1889 25.32 6,041 3-86 T7-47 II,l68 2.56 23-78 I2,°47 5-u 23.00 4,938 3.30 24.50 4,802 1890 24.87 6,409 3-97 20.98 12,306 2.94 23.70 12,586 5.26 21.51 4,684 3.02 24.40 4,876 1891 26.3I 5,909 3-56 21.11 11,854 2.81 22.45 12,430 5.i3 20.82 4,743 '2.96 25.01 7,940 1892 25-95 6,06l 3-55 20.31 11,465 2.68 23.24 II»I53 4-54 19.97 4,357 2.66 24.97 7.745 1893 25.30 6,163 20.83 11,426 2.65 22.25 12,267 4.92 21.01 4,671 2.72 24.04 7.418 1894 22.76 5,73° 3.16 17.80 10,570 2.43 21.32 12,376 S-io 17-57 4,283 2.51 23.20 7,417 1895—.— 23.10 6,283 3-34 1896 21.54 5,926 3.06 (Othe r data not yet publis hed.) Average, ? 1884-89 $ ' * 26.01 .... 4-23 19.58 .... 2.84 24.38 5-20 23.69 .... 3-39 26.58 .... Average, ? 1889-94 s ■* 25.08 .... 3 60 19-75 .... 2.68 22.78 5-i° 20.64 .... 2.86 24-35 .... Decrease, f Per cent. > 14.8 5.6 1.9 15-6 7.20 7-23 7*°4 6.42 6.26 5-85 5-85 5-76 5-50 5.16 5.06 6.83 5-53 19.0 Note—The ratio of deaths to population has been calculated from the figures given in the official reports, but the mortality rates for Paris are somewhat higher than they should be, as the last census in Paris was taken in 1891, and no allowance is made for increase of population. In Berlin, on the contrary, the rates are somewhat lower than they should be, owing to the mode of estimating the population in Berlin, which, when the census was taken, in 1895-96, proved to be incorrect. In Vienna, in 1891, the suburban districts were included in the city limits, which accounts for the greater number of deaths from that time. From an examination of this table it appears that tubercular dis- eases have caused from one-fourth to one-seventh of the deaths from all causes in these five great cities, during the period from 1884 to 1894, in- clusive; that along with the decline in the general death-rate, there has been a gradual but decided decrease in the death-rates from tubercular diseases, not in one but in all of these cities; and that the lowest death- rates have been in London, Berlin and New York. In 1888 and 1889 the sanitary authorities began to take more active steps to prevent the spread of tuberculosis, except in England, where such precautions were previously introduced. The table shows the average death-rates from tubercular diseases from 1884 to 1889, and from 1889 to 1894, with the percentage of decrease of mortality from this cause, during the latter period. The greatest percentage of decrease in the death-rate from tuberculosis has occurred in New York, Berlin and Vienna. New](https://iiif.wellcomecollection.org/image/b22380747_0055.jp2/full/800%2C/0/default.jpg)
 No text description is available for this image
 No text description is available for this image
 No text description is available for this image