On some of the causes of the high rate of mortality in Greenock : with an account of their origin, as well as of the measures which have been taken, and are still required, for their abatement or removal / by James Greenock.
- Wallace, James
- Date:
- 1860
Licence: Public Domain Mark
Credit: On some of the causes of the high rate of mortality in Greenock : with an account of their origin, as well as of the measures which have been taken, and are still required, for their abatement or removal / by James Greenock. Source: Wellcome Collection.
Provider: This material has been provided by The Royal College of Surgeons of England. The original may be consulted at The Royal College of Surgeons of England.
4/30
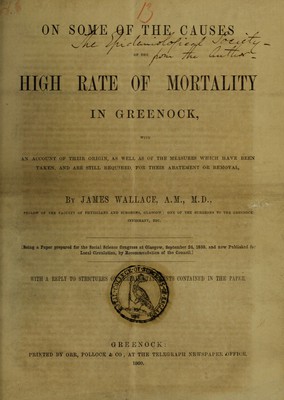
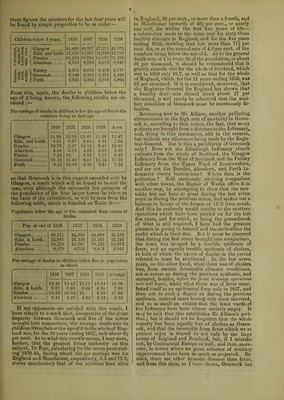
![far more unfavourable to the former than what has actually been made out by the Registrar-General. But it may be objected that the Registrar-General, though he urges a satisfactory reason for doing so, and has sources of information available only to himself, does not make the population, from the birth-estimate, high enough—not so high as Mr Allison, who, computing the excess of births over deaths from 1851, makes it no less than 42,872. Will the relative position of Greenock, however, be much altered in this way 1 To ascertain this it will be necessary, keeping for the reason given above by the census estimate for Glasgow, Edinburgh, Dun- dee and Aberdeen, to get the average iucreose by excess of births over deaths for the other four towns. Now, for the five years ending 1859, the excess of births over deaths was for Paisley, Greenock, Leith, and Perth, respectively, 2430, 2783, 2218, and 711, so that there was an average increase in this way of 487, 556, 443, and 142 per annum. Assuming, for ease of calculation, that the last census was taken on January 1st, instead of March 30th, 1851, as was actually the case, the population of these towns on January 1st, 1855, would be the population at last census plus four times the average increase just given, and this would be found to be equal for the four towns respectively to 50,019, 39,660, 33,991, and 26,009. The real excess of births over deaths for each of the subsequent years being known and regularly added, the population at the end of 1855, 1856, 1857, 1858, and 1859, will be found to be as under :— Table A. Pop. at end of 1855 1856 1857 1858 1859 Paisley Greenock ... Leith 50,350 40,026 34,443 26,101 50,922 40,703 34,775 26,332 51,274 41.3S7 35,257 26,337 51,792 42.112 35,680 26,4,0 52 457 42,440 36,209 26,720 Perth Calculating from these numbers, the death-rate for the eight towns will be found to be as follows:— Table B. 1855 1856 1857 1858 1859 Aver. One in One in One in One in One it: )nc in £ c Glasgow 33 35 33 33 35 33.8 1 Edinburgh... 40 42 47 43 49 44.2 • 5 Dundee 39 32 44 39 41 39. 9* a © o —i O Aberdeen ... 46 47 45 48 47 46.6 oS Paisley 38 46 35 40 44 40.6 ] Greenock ... 29 32 33 38 29 32.2 Leith 51 42 47 45 50 47. o Perth 40 47 33 39 47 41.2 From this it is evident that Greenock is not only “one of the unhealthiest towns of Scotland,’'but actually the most unhealthy. And even if the pre- posterously low estimate of the population from the birth increase for the four larger towns be admitted, “ the erroneous impression, as the Master of Works is pleased to term it, will still be found to obtain, the average rate for the five years ending 1859 being equalled only by that of Glasgow, as will be seen by the following table:— Table C. •5.2 -j Glasgow. . v -5 | Edinburgh g-3 I Dundee ... ^ £• l Aberdeen. 1855. 1856. 1857. One in One in One in 32 34 31 39 40 44 38 35 38 45 46 45 1858. 1859. Aver. One in One in One in 31 33 32.2 40 46 41.8 37 39 37.4 48 47 46.2 So much, then, for part of Mr Allison’3 charge that the Registrar-General “ greatly over-states the per centage of mortality” and that “ L'r Wallace’s statements are also “ wrong in data.” But Mr Allison is not the only writer who attempts to buff the Registrar-General, for he is seconded by a person who pounces upon that officer for the way in which he has stated the great mortality occurring in children. This would-be statistician, however, does not understand the question. lie tries to prove that “there is no truth in the assertion that our young children die at the rate of 60, 50, 40, or even 30 out of every 100, or that we have a greater mortality than other towns,—in fact, that the great infantile mortality is “ a delusion.” He evidently means that this mor- tality is alleged to take place annually in every 100 born or living. If he reads the reports carefully however, he will see that the Registrar-General never puts the mortality as he has stated it. What the Registrar-General actually does say is that of the deaths occurring in a particular town, 30, 40, or 60 per cent, as the case may be, take place in children below the age of 5 ; and this, I believe, for the great practical purpose of rousing the authorities in different places to a sense of the necessity of being vigilant as regards the public health, is in the long run as useful a mode of showing the result as any of the others employed by writers on this subject. To make this clear the Registrar-General himself actually made, in his last annual report, a calcula- tion of the per centage of deaths occurring in the estimated number of children living below the age of five, the table thus formed completely corroborat- ing the result given in the other way. To make the matter still more distinct, and more especially as'the Registrar-General’s estimate of the population has been disputed, I shall construct a table for the four years ending 1859 on the estimate given in Table A for the four smaller towns, and on the census esti- mate for the four larger. I have to state, then, that at the last census the number of children living be- low the age of five was in Glasgow, 40,719, Edin- burgh and Leith, 21,901, Dundee, 9,170, Paisley, 6,204, Greenock, 4,781, and Perth, 2,823. From * The population of these towns, calculated as for the others in table A, is as follows:— Table D. Glasgow Edinburgh.. Dundee Aberdeon... 1855 1S56 1857 1858 1859 349,120 166,695 85,042 76,467 354,083 167,862 85,977 77,227 358,517 169,409 87,304 77,904 362,935 170,4l5 88,447 78,687 368,049 172,197 89,703 79,422](https://iiif.wellcomecollection.org/image/b22327071_0006.jp2/full/800%2C/0/default.jpg)