[Report 1924] / Medical Officer of Health, Smethwick County Borough.
- Smethwick (Worcestershire, England). County Borough Council.
- Date:
- 1924
Licence: Attribution 4.0 International (CC BY 4.0)
Credit: [Report 1924] / Medical Officer of Health, Smethwick County Borough. Source: Wellcome Collection.
14/58 page 10
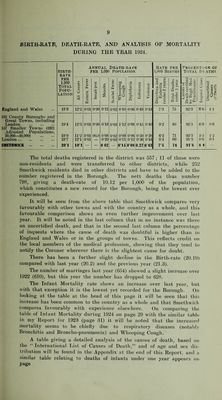
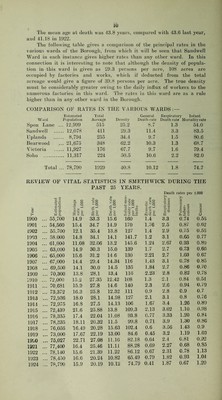
![lU The mean age at death was 43.8 years, compared with 43.6 last year, and 41.18 in 1922. The following table gives a comparison of the principal rates in the various wards of the Borough, from which it will be seen that Sandwell Ward in each instance gives higher rates than any other ward. In this connection it is interesting to note that although the density of ijoprda- tion in this ward is given as 29.3 persons per acre, 108 acres are occupied by factories and works, which if deducted from the total acreage would give a figure of 39.8 persons per acre. The true density must be considerably greater owing to the daily influx of workers to the numerous factories in this ward. The rates in this ward are as a rule higher than in any other ward in the Borough. COMPARISON OF RATES IN THE VARIOUS WARDS: — Ward Estimated Population Total Acreage Density General Death-rate Respiratory Death-rate Infant Mortality rate Spoil Lane . .. 12,999 515 25.2 8.7 1.3 54.0 Sandwell ,.. 12,078 411 29.3 11.4 3.3 83.5 Uplands .... .. 8,794 255 34.4 9.7 1.5 80.6 Bearwood .. 21,675 348 62.2 10.3 1.3 68.7 Victoria .. 11,927 176 67.7 9.7 1.6 79.4 Soho . ... 11,317 224 50.5 10.6 2.2 82.0 Total . .. 78,790 1929 40.8 10.12 1.8 74.7 REVIEW OF VITAL STATISTICS IN SMETHWICK DURING THE PAST 25 YEARS. Death rates per 1.000 II o V o O ?.£o <l> y o c S y rt .2 ° - o ^ o. .S £S IS - o rt .r 0) c , 2 s Year dS a ^ a Q. ■si K Infar tality per 1 birth r rt •- >. u N-c a C- ■^' % PllllV tuber CUloij rt u 1900 ... 55,700 14.9 33.3 15.6 160 1.4 3“3 0.74 0.55 1901 ... 54,560 15.4 34.7 14.9 170 1.76 2.5 0.87 0.62 1902 ... 55.700 12.1 35.4 13.8 127 1.4 2.9 0.75 0.55 1903 ... 58.000 14.8 34.1 14.1 141.7 1.2 3.1 0.65 0.7? 1904 ... 61,001 11.08 32.06 13.2 145.6 ].24 2.67 0.93 0.80 1905 ... 63,000 14.9 30.3 15.0 139 1.7 2.7 0.73 0.60 1906 ... 65,000 15.6 31.2 14.6 130 2.21 2.7 1.03 0.67 1907 ... 67,000 14.4 29.4 14.34 116 1.43 3.1 0.78 0.85 1908 ... 69,500 14.1 30.0 14.5 135 1.84 2.7 0.86 0.70 1909 ... 70,300 13.8 28.1 13.4 116 2.23 2.8 0.82 0.78 1910 ... 72,000 15.2 27.35 12.42 108 1.3 2.1 0.84 0.5-1 1911 ... 70,681 15.9 27.8 14.6 140 2.3 2.6 0.94 0.79 1912 ... 73,372 16.3 25.8 12.32 111 0.9 2.8 0.9 0.7 1913 ... 72,936 18.0 28.1 14.98 127 2.1 3.1 0.8 0.76 1914 ... 72,975 16.8 27.5 14.13 106 1.67 3.4 1.26 0.89 1915 ... 72,439 21.6 25.88 13.8 109.3 2.13 3.02 1.10 0.98 1910 ... 78,335 17.4 22.04 11.08 93.8 0.77 3.33 1.20 0.84 1917 ... 78,335 18.11 20.32 11.5 99.8 0.71 3.9 1.30 0.80 1918 ... 76,056 16.49 20.28 15.63 102.4 0.6 3.56 1.43 0.9 1919 ... 73,000 17.67 22.19 13.00 84.6 0.45 3.2 1.19 1.03 1920 ... 75,027 22.71 27.08 11.16 82.18 0.64 2.4 0.81 0.92 1921 ... 77,400 16.4 25.46 11.11 88.28 0.69 2.27 0.68 0.85 1922 ... 78,140 15.6 21.39 11.22 86.12 0.67 2.31 0.78 1.13 1923 ... 78,410 16.6 20.24 10.82 65.49 0.79 1.82 0.93 1.04 1924 ... 78,790 15.9 20.19 10.12 74.79 0.41 1.87 0.67 1.20](https://iiif.wellcomecollection.org/image/b30091160_0014.jp2/full/800%2C/0/default.jpg)