Report on the meteorology of London, and its relation to the epidemic of cholera / by James Glaisher.
- Date:
- 1855
Licence: Public Domain Mark
Credit: Report on the meteorology of London, and its relation to the epidemic of cholera / by James Glaisher. Source: Wellcome Collection.
Provider: This material has been provided by the Royal College of Physicians of Edinburgh. The original may be consulted at the Royal College of Physicians of Edinburgh.
68/144 (page 52)
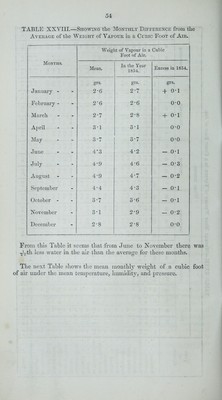
![It would seem therefore that the distribution of humidity has been very irregular, and few general results can be drawn from the fore- going numbers. Its distribution is generally under the influence of local circumstances, and has been in great measure influenced by the proximity of the liiver Thames. The most humid station, as might be expected, is the Dreadnought Hospital Ship, but the least humid is scarcely to be determined. Those of Highgate and Enfield might have been so considered had they not in some few weeks ex- ceeded in humidity the mean of all others. The following Table contains the mean monthly humidity compared with the humidity of the year 1854 :— TABLE XXVI.—Showing the Monthly Difference of the IlmriDiTY of the Air from the Average, for the Year 1854. Humidity of the Air (Complete Saturation = 1000.) Excess in the Year 1854 ]\IOXTIlS. Average. IMean in the Year 1854. above the Average. January - 885 917 4-32 February - 872 843 -29 INIarch 825 795 -30 April 802 775 -27 INIay - - 780 . 850 + 70 J line 758 825 + 67 July 788 783 — 5 August 810 771 -39 September 827 770 -57 October - 862 846 -16 November 885 916 + 31 December 889 872 -17 From the numbers in the last column, it seems that January, May, June, and November, were more humid than the average, and that the remaining months were less so than usual. Tlie following Table contains the weight of vapour in a cubic foot of air in every week, and the next Table the monthly values.](https://iiif.wellcomecollection.org/image/b21971602_0068.jp2/full/800%2C/0/default.jpg)