Census of England & Wales, 1931 : general report.
- General Register Office Northern Ireland
- Date:
- 1950
Licence: Public Domain Mark
Credit: Census of England & Wales, 1931 : general report. Source: Wellcome Collection.
107/216 page 95
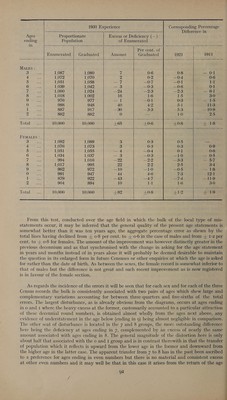
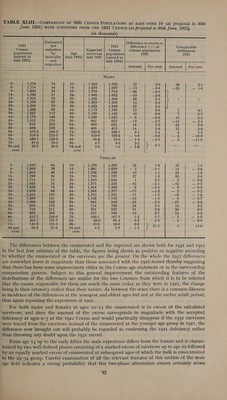
![TABLE XLIII.—Comparison oF 1931 CENSUS POPULATIONS AT AGES OVER 10 (as projected to 30th June, 1931) WITH SURVIVORS FROM THE 1921 CENsUs (as projected to 30th June, 1921) (1m thousands) Estimated Difference as excess or 1921 net 1931 deficiency (—) of Comparable Census reduction Expected Census Census population differences population by Age survivors | population 1931 1921 (carried to mortality | (mid 1931) |} mid 1931 | (carried to mid 1921) and mid 1931) migration Amount | Per cent, Amount Per cent. te MALES O- 1,376 74 10- 1,302 1,329 27 2-0 38 2-1 4— 1,714 44 14— 1,670 1,657 —13 —0:8 —32 — 1:8 9- 1,830 54 19- 1,776 1,710 —66 —3-9 14— 1,766 71 24— 1,695 1,652 —43 —2°6 19- 1,503 75 29— 1,428 1,496 68 4-5 ? ? 24— 1,350 67— 34- 1,283 1,295 12 0-9 29— 1,295 73 39— 1,222 1,249 27 2-2 34— 1,266 93 44— 1,173 1,183 10 0:8 1 0-1 39— 1,247 117 49— 1,130 1,140 10 0-9 i 0-7 44— 1,175 146 54— 1,029 1,023 — 6 —0-6 19 2-3 49— 1,015 174 59— 841 822 —19 —2°3 —15 — 2-4 54— 819 210 64— 609 623 14 2-2 24 5:0 59— 636 235 69- 401 415 14 3-4 12 3-8 64— 476°5 246-5 74— 230-0 238-1 8-1 3-4 4 2:2 69- 316°5 213°5 79— 103-0 102-4 — 0:6 —0-6 — 8 —10-0 74— 180-7 ~ 145-9 84— 34:8 33-0 — 18 —5-5 — 3 —11-0 79— 81-0 76-3 89-— 4:7 6:9 2-2, 5] 84 and 33-7 30-9 94 and 2:8 1-0 — 18 } $e a over over FEMALES 0- 1,340 10- 1,276 1,300 24 1:8 35 les 4— 1,699 14— 1,661 1,659 — 2 —0-1 —14 — 0:8 9- 1,812 19— 1,766 1,785 19 1-1 25 1-5 14— 1,789 24— 1,730 1,757 27 1-5 59 3-6 19- 1,714 29— 1,643 1,644 1 0-1 — 9 — 06 24— 1,645 34— 1,571 1,539 —32 —2-1 —52 — 35 29— 1,538 39- 1,464 1,458 — 6 —0-4 — 9 — 06 34-— 1,478 44— 1,394 1,377 —17 —1-2 — 2 — 0:2 39— 1,410 49-— 1,310 1,293 —17 —1-3 —19 — 18 44— 1,269 54— 1,148 1,132 —16 —1-4 — 6 — 0-7 49— 1,084 59- 941 918 —23 —2°5 —27 — 38 54- 890 64- 714 738 24 3-3 18 3-2 59— 712 69-— 501 532 31 5:8 26 6-3 64— 562 74— 317 336 19 5:7 14 5:3 69— 412-7 79-— 166-1 167-3 1-2 0-7 — 5 — 4:0 74— 263-1 84— 65-6 65-4 — 0-2 — 0-3 — 3 — 6-0 79— 131-3 89— 10:0 16:5 6:5 \ 21-2 13-6 84 and 66-8 94 and 4-2 2:8 1-4 over over The differences between the enumerated and the expected are shown both for 1931 and 1g21 in the last four columns of the table, the figures being shown as positive or negative according to whether the enumerated or the survivors are the greater. On the whole the 1931 differences are somewhat lower in magnitude than those associated with the 1921 record thereby suggesting that there has been some improvement either in the Census age statement or in the survivorship computation process. Subject to this general improvement the outstanding features of the distributions of the differences are similar for the two Censuses from which it is to be inferred that the causes responsible for them are much the same today as they were in 1921, the change being in their intensity rather than their nature. As between the sexes there is a common likeness in incidence of the differences at the youngest and oldest ages but not at the earlier adult period, thus again repeating the experience of 1921. For both males and females at ages 10-13 the enumerated is in excess of the calculated survivors; and since the amount of the excess corresponds in magnitude with the accepted deficiency at ages 0-3 at the 1921 Census and would practically disappear if the 193I survivors were traced from the survivors instead of the enumerated at the younger age group in 1g2r, the difference now brought out will probably be regarded as confirming the 1g21 deficiency rather than throwing any doubt upon the 1931 record. From age 14 up to the early fifties the male experience differs from the female and is charac- terised by two well-defined phases consisting of a marked excess of survivors up to age 29 followed by an equally marked excess of enumerated at subsequent ages of which the bulk is concentrated in the 29-34 group. Careful examination of all the relevant features of this section of the male age field indicates a strong probability that this two-phase alternation almost certainly arises](https://iiif.wellcomecollection.org/image/b32183203_0107.jp2/full/800%2C/0/default.jpg)
 No text description is available for this image
 No text description is available for this image
 No text description is available for this image