Census of England & Wales, 1931 : general report.
- General Register Office Northern Ireland
- Date:
- 1950
Licence: Public Domain Mark
Credit: Census of England & Wales, 1931 : general report. Source: Wellcome Collection.
141/216 page 129
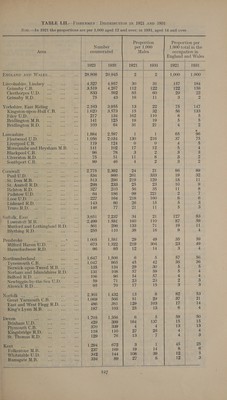
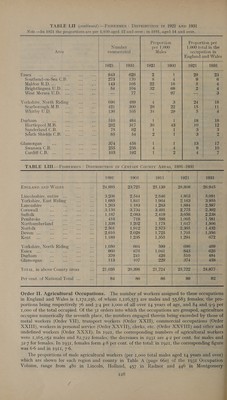
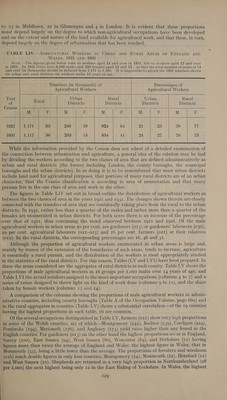
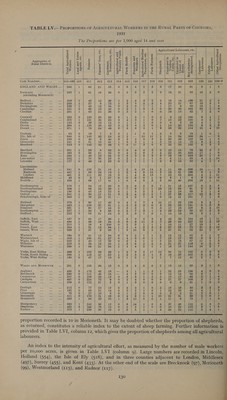
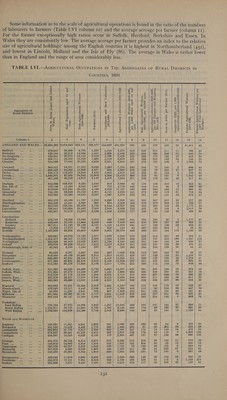
![must depend largely on the degree to which non-agricultural occupations have been developed and on the extent and nature of the land available for agricultural work, and that these, in turn, depend largely on the degree of urbanisation that has been reached. TABLE LIV.—AGRICULTURAL WoRKERS IN URBAN AND RURAL AREAS OF ENGLAND AND WALES, 1921 AND 1931 Notre.—The figures given below refer to workers aged 14 and over in 1931, but to workers aged 12 and over in 1921. -In 1921 there were 6,246 males and 330 females aged 12 and 13; so that the total number of males of 14 and over (in thousands) should be reduced from 1,171 to 1,165. It is impossible to adjust the 1921 numbers shown for urban and rural districts for workers under 14 years of age. Numbers (in thousands) of Percentages of Agricultural Workers Agricultural Workers Year Total Urban Rural Urban Rural oe | ae Districts Districts Districts Districts Census |_-————_-_ 1921 List 83 248 19 924 64 2s 23 79 de 1931 i a 56 263 15 854 4] 24 oa 76 73 While the information provided by the Census does not admit of a detailed examination of the connection between urbanisation and agriculture, a general idea of the relation may be had by dividing the workers according to the two classes of area that are defined administratively as urban and rural districts (the former including London, the county boroughs, the municipal boroughs and the urban districts). In so doing it is to be remembered that most urban districts include land used for agricultural purposes, that portions of many rural districts are of an urban character, that the Census classification is according to area of enumeration and that many persons live in the one class of area and work in the other. The figures in Table LIV set out in broad outline the distribution of agricultural workers as between the two classes of area in the years 1921 and 1931. The changes shown therein are closely connected with the transfers of area that are continually taking place from the rural to the urban districts. In 1931, rather less than a quarter of the males and rather more than a quarter of the females are enumerated in urban districts. For both sexes there is an increase of the percentage over that of 1921, thus continuing the trend observed between I91I and 1921. Of the male agricultural workers in urban areas 50 per cent. are gardeners (013) or gardeners’ labourers (030), 29 per cent. agricultural labourers (021-023) and 16 per cent. farmers (011) or their relatives (o12). In the rural districts, the corresponding percentages are 16, 46 and 31. Although the proportion of agricultural workers enumerated in urban areas is large and, mainly by reason of the extension of the boundaries of such areas, tends to increase, agriculture is essentially a rural pursuit, and the distribution of the workers.is most appropriately studied in the statistics of the rural districts. For this reason, Tables (LV and LVI) have been prepared. In these the areas considered are the aggregates of rural districts in each county. Table LV shows the proportions of male agricultural workers in 16 groups per 1,000 males over 14 years of age; and Table LVI the actual numbers assigned to the more important occupations (columns 4 to 7) and a series of ratios designed to throw light on the kind of work done (columns 9 to 12), and the share taken by female workers (columns 13 and 14). A comparison of the columns showing the proportions of male agricultural workers in admin- istrative counties, including county boroughs (Table A of the Occupation Volume, page 660) and - in the rural aggregates in counties (Table LV) shows a substantial correlation—of the Ig counties having the highest proportions in each table, 16 are common. Of the several occupations distinguished in Table LV, farmers (orr) show very high proportions in some of the Welsh counties, six of which—Montgomery (242), Radnor (239), Cardigan (224), Pembroke (194), Merioneth (176), and Anglesey (173) yield rates higher than any found in the English counties. For gardeners (013) on the other hand the highest proportions occur in England, Surrey (100), East Sussex (94), West Sussex (86), Worcester (84), and Berkshire (72) having figures more than twice the average of England and Wales: the highest figure in Wales, that in Monmouth (33), being a little lower than the average. The proportions of foresters and woodmen (016) reach double figures in only four counties, Montgomery (14), Monmouth (12), Hereford (11) and West Sussex (10). Shepherds are returned in a very high proportion in Northumberland (28 per 1,000) the next highest being only 12 in the East Riding of Yorkshire. In Wales, the highest I29](https://iiif.wellcomecollection.org/image/b32183203_0141.jp2/full/800%2C/0/default.jpg)
 No text description is available for this image
 No text description is available for this image
 No text description is available for this image