Census of England & Wales, 1931 : general report.
- General Register Office Northern Ireland
- Date:
- 1950
Licence: Public Domain Mark
Credit: Census of England & Wales, 1931 : general report. Source: Wellcome Collection.
148/216 page 136
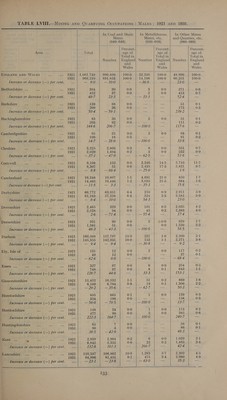
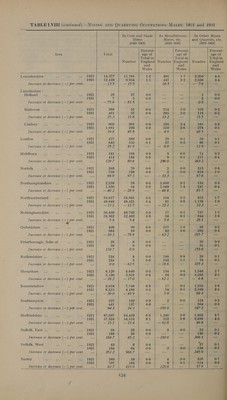
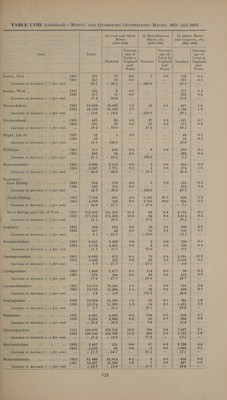
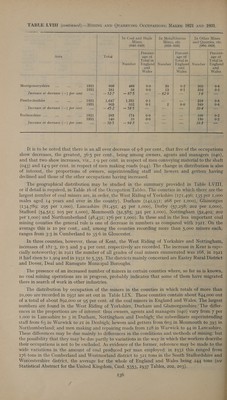
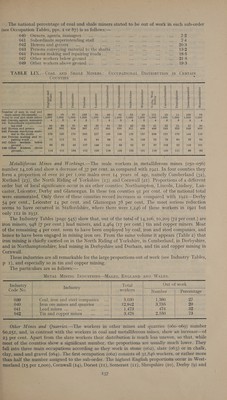
![TABLE LVIII (continued)—MINING AND QUARRYING OCCUPATIONS: MALEs: 1921 AND 1931. a rl a In Coal and Shale | In Metalliferous In Other Mines Mines Mines, etc. and Quarries, etc. (040-049) (050-056) | (060-069) Percent- Percent- ' | Percent- Area Totad age of age of age of Total in Total in Total in Number | England) Number | England] Number | England and and and Wales / Wales Wales Montgomeryshire... se seg LAL 806 466 0-0 35 0-2 305 0-6 1931 381 58 0-0 13 0-1 310 0-5 Increase ov decrease (—) per cent. Ae — 52:7 —8/5 == — 62:9 == 16 as Pembrokeshire a3 oe os ~ 1924 1,647 L33t 0-1 —- — 316 0-6 1931 903 552 0-1 2 0-0 349 0-6 Increase or decrease (—) per cent. - — 45-2 — 58:5 — --- — 10-4 joc Radnorshire ... xs ie ee ed, 283 174 0-0 a —- 109 0-2 1931 140 10 0-0 --= — 130 0-2 Increase ov decrease (—) per cent. Re = at — 94-3 = a — 19:3 — It is to be noted that there is an all over decrease of 9:8 per cent., that five of the occupations show decreases, the greatest, 36-5 per cent., being among owners, agents and managers (040), and that two show increases, viz., I-g per cent. in respect of men conveying material to the shaft (043) and 14-9 per cent. in respect of men making roads (044). The change in distribution is also of interest, the proportions of owners, superintending staff and hewers and getters having declined and those of the other occupations having increased. The geographical distribution may be studied in the summary provided in Table LVIII, or if detail is required, in Table 16 of the Occupation Tables. The counties in which there are the largest number of coal miners are, in order, the West Riding of Yorkshire (171,496; 135 per 1,000 males aged 14-years and over in the county), Durham (142,931; 268 per 1,000), Glamorgan (134,789; 295 per 1,000), Lancashire (81,451; 45 per 1,000), Derby (57,258; 202 per 1,000), Stafford (54,513; 105 per 1,000), Monmouth (52,585; 321 per 1,000), Nottingham (52,402; 202 per 1,000) and Northumberland (48,431; 176 per 1,000). In these and in the less important coal mining counties the general rule is one of decrease in numbers as compared with 1921. On the average this is Io per cent., and, among the counties recording more than 5,000 miners each, ranges from 3-3 in Cumberland to 35-6 in Gloucester. In three counties, however, those of Kent, the West Riding of Yorkshire and Nottingham, increases of 181-3, 10-5 and 5-4 per cent. respectively are recorded. The increase in Kent is espe- cially noteworthy; in 1911 the number of all grades of coal miners enumerated was 168, in Ig2I it had risen to 1,904 and in 1931 to 5,355. The districts mainly concerned are Eastry Rural District and Dover, Deal and Ramsgate Municipal Boroughs. The presence of an increased number of miners in certain counties where, so far as is known, no coal mining operations are in progress, probably indicates that some of them have migrated — there in search of work in other industries. The distribution by occupation of the miners in the counties in which totals of more than 10,000 are recorded in 1931 are set out in Table LIX. These counties contain about 844,000 out of a total of about 892,000 or 95 per cent. of the coal miners in England and Wales. The largest numbers are found in the West Riding of Yorkshire, Durham and Glamorganshire.* The differ- ences in the proportions are of interest: thus owners, agents and managers (040) vary from 7 per 1,000 in Lancashire to 3 in Durham, Nottingham and Denbigh; the subordinate superintending staff from 63 in Warwick to 21 in Denbigh; hewers and getters from 603 in Monmouth to 393 in Northumberland; and men making and repairing roads from 128 in Warwick to 44 in Lancashire. These differences may be due mainly to differences in the conditions and methods of mining: but the possibility that they may be due partly to variations in the way in which the workers describe ~ their occupations is not to be excluded. As evidence of the former, reference may be made to the wide variations in the amount of coal produced per man employed: in 1931 this ranged from 176 tons in the Cumberland and Westmorland district to 321 tons in the South Staffordshire and Worcestershire district, the average for the whole of England and Wales being 244 tons (see Statistical Abstract for the United Kingdom, Cmd. 5353, 1937 Tables, 202, 203). 136](https://iiif.wellcomecollection.org/image/b32183203_0148.jp2/full/800%2C/0/default.jpg)
 No text description is available for this image
 No text description is available for this image
 No text description is available for this image