Census of England & Wales, 1931 : general report.
- General Register Office Northern Ireland
- Date:
- 1950
Licence: Public Domain Mark
Credit: Census of England & Wales, 1931 : general report. Source: Wellcome Collection.
166/216 page 154
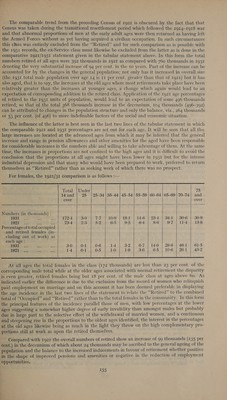
![and Stafford (125), and least numerous in Rutland (56), Montgomery (53), Lincoln, Holland (51), Brecknock (49), Cardigan (46) and Radnor (42), Order XXXII. Retired or Not Gainfully Occupied. This order consists of 1,385,526 males and 10,804,851 females. It includes students etc., in educational institutions (960), those who have retired from a previous gainful occupation (Y), and other persons in respect of whom no gainful occupation is stated (X). Persons who had at any time followed an occupation or calling for payment or profit but who were no longer so occupied or seeking to work for a living were asked to indicate the fact by recording their former occupation followed by the statement “Retired”. The obligation was however qualified in respect of women by the more general instructions that particulars of occupation (for payment or profit) and industry were not required of wives or other relatives chiefly occupied in unpaid domestic duties at home: so that in the case of women, notwithstanding that the majority of them undertake some form of paid employment prior to marriage, the record of those who had done so but had retired from such employment on marriage would not normally be included in the Census record. The total numbers of each sex thus returned and classified in 1931 as retired were 802,876 males and 172,416 females, numbers representing 5-5 per cent. of the males and I-I per cent. of the females in the total population from age of 14 upwards; the large disparity between the sexes is explained by the fact that most females marry and relinquish their former occupations in favour of domestic duties in which event they would, as already described, be largely excluded from the present reckoning. Of the “‘Retired’’? males, the numbers and proportions returned at successive ages are shewn in the following statement. Normal retirement is predominantly a feature associated with attain- ment of the more advanced ages and this is reflected by the distribution which shews that of the total retired class, 72:3 per cent. were above 65 years of age, while 16-2 per cent. were between 55 and 65 and only 11-4 per cent. younger than 55. Total | Under 75 Retired Males, 1931 l4and | 25 |25-34| 35-44 | 45-54 | 55-59 | 60-64 65-69 | 70-74 | and over over Numbers (in thousands) ... | 802-9 3-8 | 13-1 | 23-2 | 51-7 | 45-5 | 84-9 | 180-6 | 192-8 | 207-3 Distn. per 1,000 total ... | 1,000 5 16 29 64 57 106 | 225 | 240 258 Percentage of total males in each age group ... es 5:5 0-1 0-4 0-9 2:2 4-6 | 10-9}. 31-2 | 51:2.) 65-1 Total |Under 75 14 and 25 =| 25-34 | 35-44 | 45—54 | 55-59 | 60-64 | 65-69 | 70-74 | and over over Numbers (thousands) : LOO ee Re Bis Bevis ihe, OZ 392-4 Percentage of total males in each age group : LOSI x ae be: rts 5:2 LOZ tee ei oat 3-0 16-5 | 42:0 | 40:3 | 79-9 | 176-0 | 189:3 | 203-7 14:0 | 30-5 | 25-9 | 44-7 | 64-1] 89-4] 114-0 0-7 1:8 4:1 | 10-3 | 30-4] 50-2} 64:0 0-6 1-4 3:3 7-4 14-3 31:9} 45:5 In relation to the total population in each age group the percentages “‘Retired” are shewn to — increase continuously with age. Below age 45 they do not reach 1 per cent. and must be ascribed almost exclusively to the inevitable element of premature invalidity which will always be present even at the youngest ages. Thereafter the rise steepens reaching 10-9 per cent. between 60 and 65 and proceeding thence to a maximum at the final age period identified, viz., 75 and over where 651 per cent. of the population are so returned. The interest in the proportion at the higher ages — lie not so much in the incidence of retirement as of the complementary evidence it provides of — the large proportions of men who remain in active employment; it is undoubtedly a fact of social — significance that 87 per cent. of the male population between the ages of 60 and 65 were actually — in work or seeking work and that at the even higher age groups 65~70 and 70-75 the proportions : were as high as 65 per cent. and 42 per cent. respectively. eV Weee](https://iiif.wellcomecollection.org/image/b32183203_0166.jp2/full/800%2C/0/default.jpg)
 No text description is available for this image
 No text description is available for this image
 No text description is available for this image