Census of England & Wales, 1931 : general report.
- General Register Office Northern Ireland
- Date:
- 1950
Licence: Public Domain Mark
Credit: Census of England & Wales, 1931 : general report. Source: Wellcome Collection.
50/216 page 38
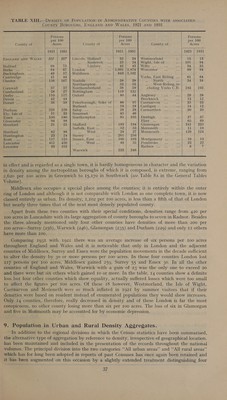
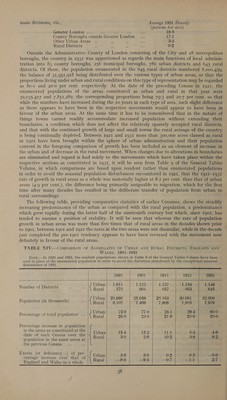
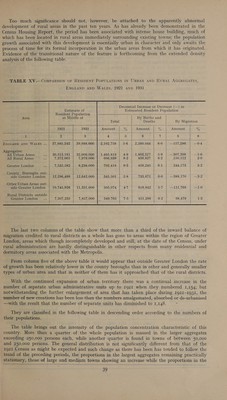
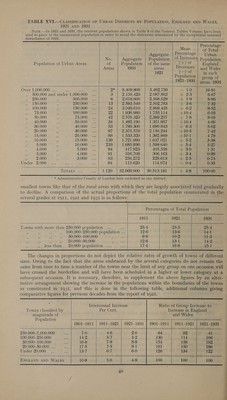
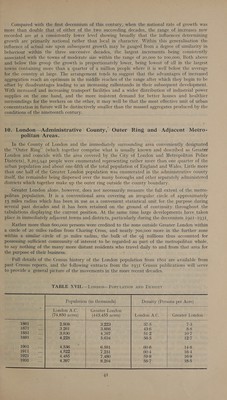
![main divisions, viz., Average 1931 Density (persons per acre) Greater London ... oe mt me oa 18-5 County Boroughs outside Greater London _... 17-1 Other Urban Areas _,, by As 3 3-3 Rural Districts ‘3 . N a 0-2 Outside the Administrative County of London consisting of the City and 28 metropolitan boroughs, the country in 193I was apportioned as regards the main functions of local adminis- tration into 83 county boroughs, 256 municipal boroughs, 780 urban districts and 645 rural districts. Of these, the population enumerated in the 645 rural districts numbered 8,000,459, the balance of 31,951,918 being distributed over the various types of urban areas, so that the proportions living under urban and rural conditions on this type of representation may be regarded as 80-0 and 20-0 per cent. respectively. At the date of the preceding Census in r1g2r1, the enumerated populations of the areas constituted as urban and rural in that year were 30,035,417 and 7,851,282, the corresponding proportions being 79-3 and 20-7 per cent. so that while the numbers have increased during the Io years in each type of area, such slight difference as there appears to have been in the respective movements would appear to have been in favour of the urban areas. At the same time it has to be remembered that in the nature of things towns cannot readily accommodate increased population without extending their boundaries, a condition which does not affect the relatively sparsely occupied rural districts, and that with the continued growth of large and small towns the rural acreage of the country is being continually depleted. Between 1921 and 1931 more than 300,000 acres classed as rural in 1921 have been brought within the sphere of urban administration and their population content in the foregoing comparison of growth has been included as an element of increase in the urban and of decrease in the rural movement. When changes due to alterations in boundaries are eliminated and regard is had solely to the movements which have taken place within the respective sections as constituted in 1931, it will be seen from Table 9 of the General Tables Volume, in which comparisons are based upon resident rather than enumerated populations in order to avoid the seasonal population disturbances encountered in Ig2r, that the 1921-1931 rate of growth in rural areas as a whole was materially higher at 8-2 per cent. than that of urban areas (4:9 per cent.), the difference being primarily assignable to migration, which for the first time after many decades has resulted in the deliberate transfer of population from urban to rural surroundings. The following table, providing comparative statistics of earlier Censuses, shows the steadily increasing predominance of the urban as compared with the rural population, a predominance which grew rapidly during the latter half of the nineteenth century but which, since 1go1, has tended to assume a position of stability. It will be seen that whereas the rate of population growth in urban areas was more than five times that of rural areas in the decades shown prior to 1g01, between rgor and 1921 the rates in the two areas were not dissimilar, while in the decade just completed the pre-1go0I tendency appears to have been reversed with the movement now definitely in favour of the rural areas. TABLE XIV.—CoMPARISON OF AGGREGATES OF URBAN AND RURAL DIstTrRIcTs, ENGLAND AND WALEs, 1891-1931 Note.—In 192] and 1931, the resident populations shown in Table 9 of the General Tables Volume have been used in place of the enumerated population in order to avoid the distortion introduced by the exceptional seasonal disturbance of 1921. 1891 1901 1911 1921 1931 ae ‘SU papeneenl 1,122 1,137>.| endy154 1,148 J Urban | 20,896 25,058 28,163 30,081 32,009 Population (in thousands) |. Rural 8.107 7-469 7908 7.805 7.979 | | f Urban 72-0 77-0 78:1 79-4 80:0 Percentage of total population ... | ears 28.0 23.0 21-9 20-6 20-0 Percentage increase in population in the areas as constituted at the Tbh 15-4 15-2 aye 5.3 4-9 date of each Census over the |) p) oy 3.0) 2.9 10-2 3.9 8.2 population in the same areas at the previous Census a Excess (or deficiency—) of per- : ; ey centage increase over that of a oto ae ae eres pe England and Wales as a whole](https://iiif.wellcomecollection.org/image/b32183203_0050.jp2/full/800%2C/0/default.jpg)
 No text description is available for this image
 No text description is available for this image
 No text description is available for this image