County of London : area, houses and population also population classified by ages, condition as to marriage, occupations, birthplaces, and infrimities.
- Great Britain. Census Office.
- Date:
- 1902
Licence: Public Domain Mark
Credit: County of London : area, houses and population also population classified by ages, condition as to marriage, occupations, birthplaces, and infrimities. Source: Wellcome Collection.
16/206
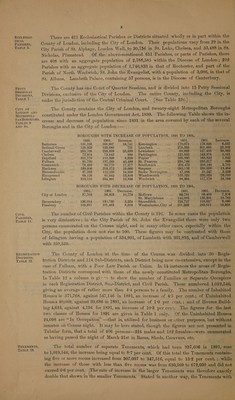
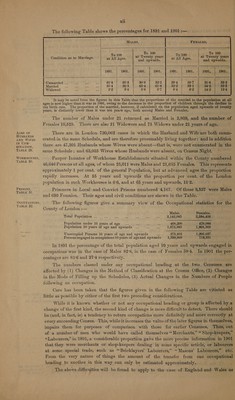
![ECCLESIAS- TICAL PARISHES, TABLE 5. BEUrY SESSIONAL DIVISIONS, TABLE 7 CITY OF TABLES 9 AND 9A. CIvin PARISHES, ~ TABLE 11. DISTRICTS, TABLE 12. TABLE 19. x There are 611 Ecclesiastical Parishes or Districts situated wholly or in part within the County of London, including the City of London. Their populations vary from 29 in the City Parish of St. Alphage, London Wall, to 30,756 in St. Luke, Chelsea, and 33,488 in St. Nicholas, Plumstead. Of the above-mentioned 611 Parishes, or parts of Parishes, there are 408 with an aggregate population of 2,786,585 within the Diocese of London; 202 Parishes with an aggregate population of 1,746,833 in that of Rochester, and part of the Parish of North Woolwich, St. John the Evangelist, with a population of 3,086, in that of St. Albans. Lambeth Palace, containing 37 persons, is in the Diocese of Canterbury. The County has one Court of Quarter Sessions, and is divided into 15 Petty Sessional Divisions, exclusive of the City of London. The entire County, including the City, is under the jurisdiction of the Central Criminal Court. [See Table 22c.] The County contains the City of London, and twenty-eight Metropolitan Boroughs constituted under the London Government Act, 1899. The following Table shows the in- crease and decrease of population since 1891 in the area covered by sisi of the several Boroughs and in the City of London :— BOROUGHS WITH INCREASE OF POPULATION, 1891 TO 1901. 1891. 1901. Increase. 1891. 1901. Increase. Battersea 150,166 168,907 18,741 | Kensington 170,071 176,628 = 6,557 Bethnal Green 128,929 129,680 751 | Lambeth : 278,393 301,895 23,502 Camberwell 233,706 259,339 25,633 | Lewisham ... 88,933 127,495 38,562 Chelsea ie 72,954 73,842 888 | Paddington 135,955 143,976 ' 8,021 Deptford... ae 101,770 110,398 8,628 | Poplar 166,880 168,822 | 1,942 Fulham B. 91,790 137,289 45,499 | St. Pancras 234,749 © 235,317 568 Greenwich ... 78,493 95,770 17,277 | Southwark ... 202,479 206,180 3,701 Hackney 199,606 219,272 19,666 | Stepney 285,116 298,600 13,484 Hammersmith 97,283 112,239 14,956 | Stoke New ington.. 47, 988 51,247 _ 3,259 Hampstead 68,126 81,942 13,816 | Wandsw orth 155,524 232,034 76,510 Aslington 319,155 334,991 15,836 | Woolwich ... 98,994. 117,178 18,184 BOROUGHS WITH DECREASE OF POPULATION, 1891 TO 1901, byte) 1891. 1901. Decrease. 1891. , 1901. . Decrease. City of London 37,702 26,923 10,779 | Holborn 7 66,781 ~ 69,405 7,376 : St. Marylebone 144,083 133,301 .. 10,782 Bermondsey 136,014 130,760 5,254 | Shoreditch. ... Be Pula Ly: |S 118,637 — 6,090 Finsbury 109,981 101,463 8,518 | Westminster,City of 201,969 © 183,011 . 18,958 ‘The number of Civil Parishes within the County is 191. In some eases the population is very diminutive; in the City Parish of St. John the Evangelist there were only two persons enumerated on the Census night, and in many other cases, especially within the City, the population does not rise to 100. These figures may be contrasted with those of Islington having a population of 334,991, of Lambeth with 301,895, and of Camberwell with 259,339. The County of London at the time of the Census was divided into 30 Regis- tration Districts and 114 Sub-Districts, each District being now co-extensive, except in the case of Fulham, with a Poor Law Parish or Union. In 14 instances the areas of Regis- tration Districts correspond with those of the newly constituted Metropolitan Boroughs. In Table 12 a column is giv° to show the number of Families or Separate Occupiers in each Registration District, Suo-District, and Civil Parish. These numbered 1,019,546, giving an average of rather more than 4°4 persons to a family. The number of Inhabited Houses is 571,768, against 547,146 in 1891, an increase of 4:5 per cent.; of Uninhabited Houses 40,069, against 39,686 in 1891, an increase of 1:0 per cent. ; and of Houses Build- ing 4,624, against 4,194 for 1891, an increase of 10°3 percent. The figures for the last two classes of Houses for 1891 are given in Table 1 only. Of the Uninhabited Houses 24,098 are “In Occupation” —that is, utilized for business or other purposes, but without inmates on Census night. It may be here stated, though the figures are not presented in Tabular form, that a total of 406 persons—224 males and 182 females—were enumerated ; as having passed the night of March 31st in Barns; Sheds, Caravans, etc. The total number of separate Tenements, which had been 937,606 in 1891, rose to 1,019,546, the increase being equal to 8-7 per cent. Of this total the Tenements contain- . ing five or more rooms increased from 307,037 to 847,516, equal to 13°2 per cent. ; while the increase of those with less than five rooms was from 630,569 to 672,030 and did not exceed 6°6 per cent. The rate of increase in the larger Tenements was. therefore exactly double that shown in the smaller Tenements. Stated in another way, the Tenements with](https://iiif.wellcomecollection.org/image/b32180433_0016.jp2/full/800%2C/0/default.jpg)