County of London : area, houses and population also population classified by ages, condition as to marriage, occupations, birthplaces, and infrimities.
- Great Britain. Census Office.
- Date:
- 1902
Licence: Public Domain Mark
Credit: County of London : area, houses and population also population classified by ages, condition as to marriage, occupations, birthplaces, and infrimities. Source: Wellcome Collection.
85/206 (page 61)
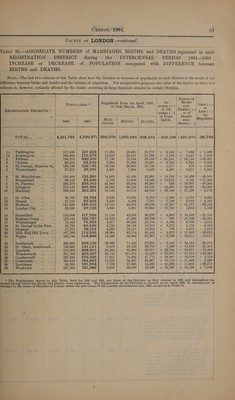
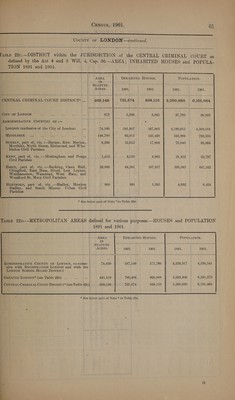
![County oF LONDON —continued. Taste 22.—-AGGREGATE NUMBERS of MARRIAGES, BIRTHS, and DEATHS registered in each REGISTRATION DISTRICT during the INTERCENSAL PERIOD — 1891—1901 ; INCREASE or DECREASE of POPULATION compared with DIFFERENCE between BIRTHS and DEATHS. NorrE.—The last two columns of this Table show how the increase or decrease of population in each District is the result of the difference between births and deaths and the balance of migration. For comparative purposes the value of the figures in these two columns is, however, seriously affected by the deaths oceurring in large hospitals situated in certain Districts. Excess of : ee Registered from Ist April, 1891, In- Births | «; POPULATION. to 3lst March, 1901, crease (+) over coed +) REGISTRATION DIsTRICTs.* on. Dee. | Deaths (+) 5 asa ¢ crease (—) or of b 2 oy of Popu- Deaths Mi ot am ; AR- ei lation. over 8 ; 1891. 1901. RIAGES. BrrTus. | DEATHS. Births (—). TOTAL... sae .. | 4,211,743 | 4,520,971} 390,079) 1,829,428 | 838,454 |+ 309,228] +490,974| -181,746 1A | Paddington ... ... 117,846 | 127,328 11,204 29,660 | 21,777 | + 9,482 | + 7,883} + 1,599 1p | Kensington ... ... 166,308 | 173,073] 15,822 36,641 31,794 | + 6,765 | + 4,847 | + 1,918 Puan jo... 188,878 | 249,219 17,730 70,168 | 39,424 | + 60,341 | + 30,744 | +29,597 3 Chelsea ... se foe 96,253 93,549 9,994 25,889 19,357 | — 2,704] + 6,532 | — 9,236 4 St. George, Hanover Sq. 134,138 129,c61 13,546 26,638 25,759 | — 65,077 | + 879 | — 95,956 5 | Westminster eh 37,312 33,081 4,625 7,694 5,023 | — 4,231] + 2,671 | — 6,902 6 St. Marylebone... a0 142,404 132,295 14,602 42,430 23,991 | — 10,109 |} + 18,489 | — 28,548 7 ©) Hampstead... .. >.: 68,416 82,329 5,134 15,089 | 12,540 | + 13,913 | + 2,549 | 411,364 8 St. Pancras ae 36 234,379 234,912 22,063 69,202 48,305 | + 533 | + 20,897 | — 20,364 9 Islington as wee 319,143 335,238 28,883 96,555 58,158 | + 16,095 | + 38,397 | —22,302 10 | Hackney unl) 989,542 | 258,201] | 19,188 70,710 | 43,182 | + 23,749 | + 27,528 | — 3,779 ll St. Giles ab 560 39,782 34,534 3,820 10,824 6,412, | — 5,248) + 4,412 | — 9,660 | A ea ae 27,516 20,323 3,459 4,569 7,581 | — 7,198 |-— 3,012| — 4,181 | 13 Holborn ... Be nee 141,920 130,538 12,741 48,063 26,326 | — 11,387} + 21,737 | —33,124 14 London City... a08 38,320 27,535 5,638 5,281 10,964 | -— 10,785 | — 5,683 | — 5,102 | ips} Shotediteh ... St .. 124,009 | 117,706] 11,118 43,218 | 28,370} — 6,308 | + 14,848 | -21,151 16 Bethnal Green ... Bee 129,132 129,727 13,476 47,892 26,796 | + 595 | + 21,096 | -— 20,501 17 Whitechapel ... ae 74,462 78,656 4,677 30,924 24,518 | + 4,194] + 6,406] — 2,212 18 St. George in the East... 45,795 49,068 2,716 20,148 10,3852 | + 3,273 | + 9,796 | — 6,523 19 | Stepney ... ee ae 57,376 58,106 4,095 19,511 12,902 | + 730 | + 6,609 | — 5,879 | 20 Mile End Old Town... 107,592 112,565 16,064 42,114 20,469 | + 4,973 | + 21,645 | -—16,672 | 21 | Poplar bole 166,748 | 168,886 14,566 59,302 | 37,287 | + 2,188 | + 22,015 | —19,877 22 Southwark ... we 202,693 206,136 29,092 71,242 37,081 | + 3,443 | + 34,161 | - 30,718 2a St. Olave, Southwark...) . 136,660 131,121 | 9,873 48,523 32,704 | — 5,539 | + 15,819 | -~-21,358 | 24 Lambeth a wre 275,203 298,951 23,294 92,982 56,971 | + 23,748 | + 36,011 | -—12,263 | 25 Wandsworth ... ee 307,500 403,107 26,175 101,074 53,859 | + 95,607 | + 47,215 | +48,392 26 Camberwell bist me 235,344 259,425 | 17,851 74,431 47,772 | + 24,081 | + 26,659 | — 2,578 27 Greenwich ths * 165,413 | 184,563 11,575 55,347 33,867 | + 19,150 |. + 21,480 | - 2,330 28 | Lewisham oe. 94,335 | 185,564. 7,124 27,048 | 15,393 | + 41,229 | + 11,655 | +29,574 29 Woolwich ae is 107,324 | 131,089 9,934 36,259 19,520 | + 23,765 | + 16,739 | + 7,026 * The Populations shown in this Table, both for 1891 and 1901, are those of the Districts as they existed in 1891, and throughout the period during which the Births and Deaths were registered. The Populations of the Districts as altered on Ist April, 1901, in consequence of changes in the Areas of Parishes or Unions under the provisions of the London Government Act, 1899, are given in Table 12.](https://iiif.wellcomecollection.org/image/b32180433_0085.jp2/full/800%2C/0/default.jpg)