Triennial vaccination report of the Province of Assam : with brief explanatory notes.
- Assam
- Date:
- [1920]
Licence: Public Domain Mark
Credit: Triennial vaccination report of the Province of Assam : with brief explanatory notes. Source: Wellcome Collection.
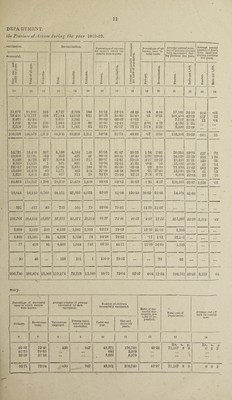
14/28 page 10
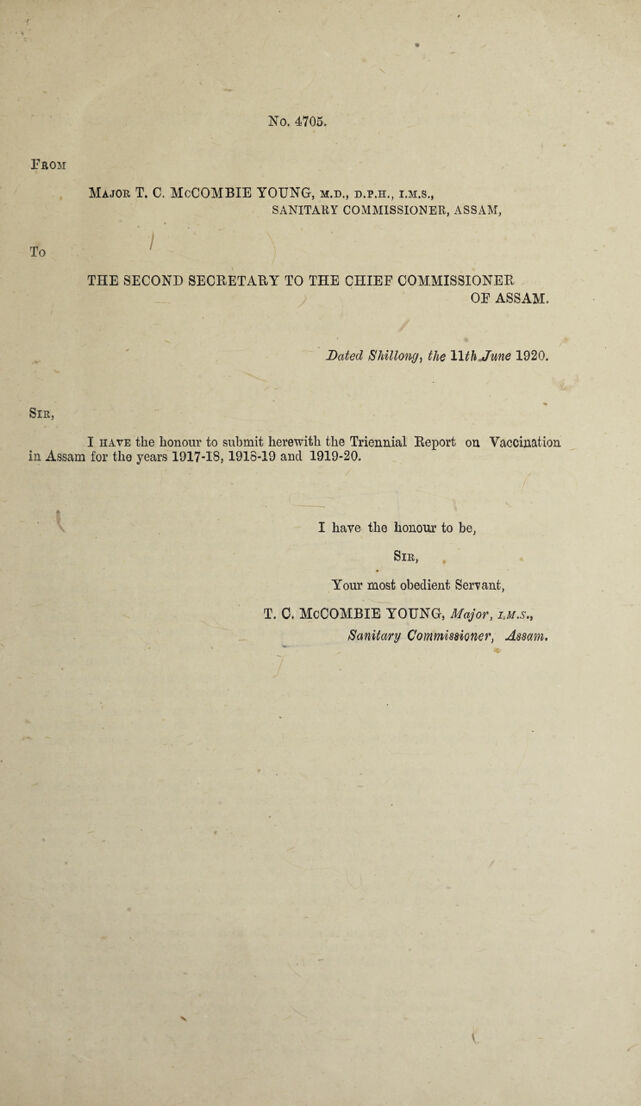
![\ A.—VACCINE Statement No. I—Showing particulars of Vaccination in No. District. \ Population of district according to the census of 1911. Average population per square mile. Average Dumber of vaccinators employed thronghout the season. 1 Total number of persons vaccinated. l Average number of persons vacci¬ nated by each vaccinator. ^ -:-1 Total. ns 2. Under one year. § 5 1 2 3 4 5 6 7 8 6 Male. Female. Total. Surma Valley and Hill Districts. 1 A Cachar 497.4G3 139 32 13,984 11,705 25,689 802 21,957 2.271 2 Sylhet ... ••• • •• 2,472,671 458 121 76,520 68,722 145,242 1,200. 117,658 9,735 3 Khasi and Jaiutia Hills 235,069 40 9 6,419 6,101 12,520 1,391 6,845 1,226 4 Naga Hills 149 623 48 5 2,857 2,497 6,3-54 1,070 3,370 655 5 Lushai Hills 91,204 12 5 4,316 3,944 8,260 1,652 6,335 141 Total of Surma Valley and Hill Districts 3,446,030 136 172 104,096 92,969 197,065 1,145 156,165 13,928 Assam Valley Distbicts. 9 •v G Goalpara 600,613 151 48 15,047 11,320 26,367 732* 21,169 5,209 7 Kamrup 667,828 173 50 18,0(5 16,179 34,244 685 33,411 7,189 8 Darrang ... ... 377,314 110 27 8/125 6,438 14,863 550 11,179 1,022 9 Nowgong 303,596 79 22 6,954 5,930 12,881 585 11,923 2,412 10 Sibsagar 690,299 138 52 16,742 14,970 31,712 609 25,717 2,70 2 11 Lakhimpur 468,989 103 31 9,585 8,540 18,125 584 16,954 2,317 12 Garo Hills ... ... ... 158,936 50 6 3,010 2,905 5,915 985 5,498 3,148 Total of Assam Valley Districts 3,267,605 118 236 77,828 66,282 144,110 610 125,881 23,999 13 Manipur State ... .i. 316,222 41 20 34,951 29,755 64,706 4,313t 26,593 5,315 14 North-East Frontier District • . . • • • 2 1,063 382 1,445 722 732 29 Total Vaccine Department 7,059,857 115 430 217,938 189,388 407,326 947 309,373 43,271 Total Dispensaries ... • • • ... 11,119 .. . 4,787 683 Total tea-gardens by garden agencies ... ... ... 9,115 . 8,981 18,09t 1 13,804 5,593 Total Jails, Lunatic Asylum, Police hos- • • # 4,818 301 6,152 683 8 pitals and Coolie Depots. Total Railways ... ... • « • ] • • • 122 ' 5 L !' 17 f 45 6 Grand total 7,059,857 115 430 232,023 193,724 441,86( 3 947 328,692 ! 49,561 * Calculated on tlie average of 36 vaccinators who worked for the whole season. •> ji 15 >» >> o _ Sum • Total number of persons vaccinated. Total number of operations perfosmed. Primary. Re-vaocinations. Primary. Re-vaccinations. . l 2 3 4 6 By special staff (Statement I) By dispensary staff (Statement III) By other agencies— tea-gardens, Jail hospital, Police hospital and cholera hospital and ccolie d< pots. Total 309,373 4,787 14,532 97.953 6,332 8,889 309,373 4,787 14,532 97,953 „ 6.332 8,889 328,692 *113,174 328,692 113,174](https://iiif.wellcomecollection.org/image/b31495849_0014.jp2/full/800%2C/0/default.jpg)