Report / Royal Commission on the National Health Service.
- Great Britain. Royal Commission on the National Health Service
- Date:
- [1979]
Licence: Open Government Licence
Credit: Report / Royal Commission on the National Health Service. Source: Wellcome Collection.
35/510 page 21
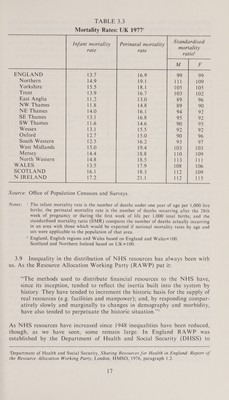
![3.16 Because of the difficulty of measuring morbidity, comparative studies of health usually stick to mortality though even here there are difficulties with the reliability and comparability of the data. Advances in medicine may improve perinatal mortality figures by preserving the lives of severely handi- capped babies who would otherwise have died at birth but whose prospects of survival for more than a few years, or of having anything like a normal life, are small. Mortality figures in any case say nothing about the quality of life: the benefits of chiropody and hip replacements will not show up in the statistics but may make the difference between immobility and self-sufficiency for many old people. Quality of life becomes increasingly important as the possibilities develop of extending life for people who would in the past have died from their illnesses or injuries, and as people live longer and the chronic conditions of old age become more common. Assessing health services 3.17 These substantial reservations must be kept firmly in mind when making historical or international comparisons. Table 3.6 shows changes in mortality rates since 1948, and Table 3.7 shows changes in life expectancy between 1950 and 1977. The question arises how far these improvements can be attributed to the NHS. In one sense it is impossible to answer because there is no way of knowing what would have happened if the NHS had not been introduced in 1948. It is likely that mortality rates would have fallen, as they have in comparable countries, whatever the organisation of health services. Perinatal mortality Infant mortality Mortality’ Age 35-44 M F Age 45-54 M F Age 55-64 M EF Source: Office of Population Censuses and Surveys. Note: ' The mortality rate is the number of deaths in that age range per 1,000 population in that age range. 2]](https://iiif.wellcomecollection.org/image/b32220315_0035.jp2/full/800%2C/0/default.jpg)


 No text description is available for this image
 No text description is available for this image
 No text description is available for this image