Heart-beat and pulse-wave / by C.S. Roy and J.G. Adami.
- Roy, Charles Smart, 1854-1897.
- Date:
- 1890
Licence: Public Domain Mark
Credit: Heart-beat and pulse-wave / by C.S. Roy and J.G. Adami. Source: Wellcome Collection.
Provider: This material has been provided by The Royal College of Surgeons of England. The original may be consulted at The Royal College of Surgeons of England.
24/94
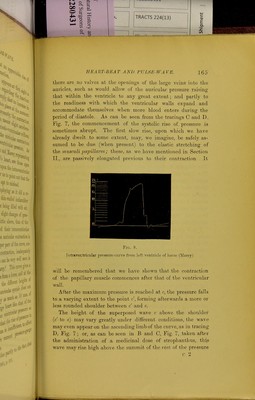
![curve. That this superposed wave is not due to any inertia- vibration of the recording apparatus is sufficiently shown by the character of the tracings. We have, moreover, made control ex- periments with the recording instrument, which show that the moving parts of it are prevented from showing inertia-vibrations, owing to the friction between the piston and the walls of the tube in which it oscillates. The intraventricular pressure-curve is, then, made up of two waves: one whose apex is at c, of short duration, and another and flatter one, upon which the former is superposed. In other words, the curve is composite, being formed of two waves that do not bear a constant relation to one another. The diagram E, Fig. 7, may serve to illustrate our meaning. The lines aa and hh show two pressure-curves as they would appear dissociated from one another; while if these be com- bined they form au interference curve. As two such waves appear upon the sphygmographic tracing, it is desirable to know- exactly how they are produced. The relationship in time of the various parts of the ventricular pressure-curve to those obtained from the heart-wall and papillary muscles indicates clearly enough the mode of their production. Fig. 9 gives a simultaneous tracing of intraventricular pres- sure and myocardiographic curves, the latter taken in a line from base to apex. It can be seen that the wave h, c, c', in curve B, corresponds in time to the interruption between h and c' of the ventricular wall curve. [The letters upon the two curves represent points which correspond in time.] This wave, then, cannot be due to the contraction of the muscular wall of the ventricle, seeing that it appears at a time when the shorten- ing of the fibres of the ventricular wall is interrupted. As already mentioned in our last Section, the interruption, he, of the myocardiographic curve coincides in time with the rapid shortening with which the papillary contraction commences. As this is the only part of the ventricular muscle which is under- going rapid contraction at this phase of the systole, it is obvious that the superposed pressure-wave c is due to the pulling down of the flaps of the auriculo-ventricular valves, which, as we have shown, are bulged upwards during the first part of systole And the arrest of the contraction of the heart-wall (6 to c in A)](https://iiif.wellcomecollection.org/image/b2228042x_0024.jp2/full/800%2C/0/default.jpg)