Licence: Attribution 4.0 International (CC BY 4.0)
Credit: National nutrition survey / Ireland, Dept. of Health. Source: Wellcome Collection.
205/350 page 23
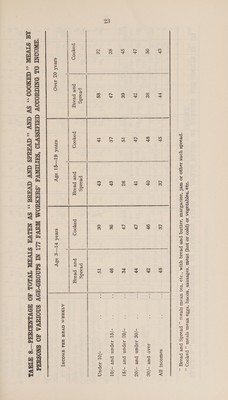
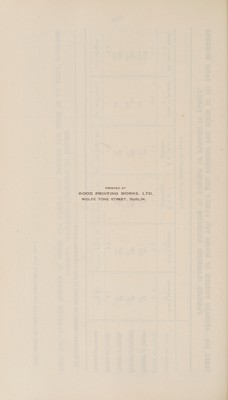
![“039 ‘SaIqe}esaa IO (ploo Io joy) yeou ‘sosesnes ‘uodeq ‘s388q Ue S[esUl ,, Payood ,, ‘peaids yons 19q30 30 wel ‘oulresrem ‘10}}Nnq pue peoiq 4}IM “O}9 ‘Va} ULOUE s[vour ,, peoids puve peoig ,, cP sae ca Sowooutr IV os SE SP OF oF Joao pue —/0¢ i L¥ oP Li I? bP -/0§ Jopun pue -/9Z Sh bh St LE | SP 6E 93 *E -/0% topun pur —/C] Se LY SP OF -/§{ Japun pue -/0] oe gs IP Sh IS -/OT 29pun peaids peoids peaids poyoo) pue peoig poyoo?y pue pesig p9xoo, pue pesig ATH@ZAM GAVAH Wad ANOONT sesh FI—e O8V sesh QZ 1940 sieoh GI—S] 38V “THIOONI OL DNIGUOOOV CHLAISSVIO ‘SHYINAVA SUMMYOM WUVA 241 NI SdNOUD-ANV SQOLAVA JO SNOSdad 5 GIVE .«caH000;, SV GNV .«.QVauUdS ANY GVAUd,, SV NELVA SIVAN TVLOL 40 GOVINDUd 8 FAVE](https://iiif.wellcomecollection.org/image/b32176818_0205.jp2/full/800%2C/0/default.jpg)

 No text description is available for this image
 No text description is available for this image
 No text description is available for this image