Licence: Attribution 4.0 International (CC BY 4.0)
Credit: National nutrition survey / Ireland, Dept. of Health. Source: Wellcome Collection.
341/350 page 83
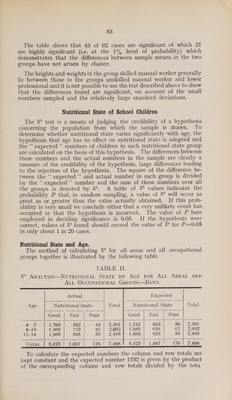
![The table shows that 43 of 92 cases are significant of which 21 are highly significant (ie. at the 1% level of probability) which demonstrates that the differences between sample means in the two groups have not arisen by chance. The heights and weights in the group skilled manual worker generally lie between those in the groups unskilled manual worker and lower professional and it is not possible to use the test described above to show that the differences found are significant, on account of the small numbers sampled and the relatively large standard deviations. Nutritional State of School Children The X? test is a means of judging the credibility of a hypothesis concerning the population from which the sample is drawn. To determine whether nutritional state varies significantly with age, the hypothesis that age has no effect on nutritional state is adopted and the ‘‘ expected ’’ numbers of children in each nutritional state group are calculated on the basis of this hypothesis. The differences between. these numbers and the actual numbers in the sample are clearly a measure of the credibility of the hypothesis, large differences leading to the rejection of the hypothesis. The square of the difference be- tween the ‘‘ expected”’ and actual number in each group is divided by the ‘“‘ expected’’ number and the sum of these numbers over all the groups is denoted by X?. A table of X? values indicates the probability P that, in random sampling, a value of X* will occur as great as or greater than the value actually obtained. If this prob- ability is very small we conclude either that a very unlikely event has occurred or that the hypothesis is incorrect. The value of P here employed in deciding significance is 0.05. If the hypothesis were correct, values of X? found should exceed the value of X°? for P=0.05 in only about I in 20 cases. Nutritional State and Age. The method of calculating X? for all areas and all occupational groups together is illustrated by the following table. TABLE I. X2, ANALYSIS—NUTRITIONAL STATE BY AGE FOR ALL AREAS AND ALL OCCUPATIONAL GROUPS—BOYS. ST TR. SEITE SIS LETT SIRT TC EDO LT DEE TE EDR LD LID LLL LSE OLE LLL IE LEBEL EE ITO EN LEAL Actual Expected Age Nutritional State Total Nutritional State Total Good Fair Poor Good Fair Poor eee Ah FBE tin S8Ip|. 2 Addl DAOT 782.4. B08 56 | 2,391 8-10 1,800 720 82 | 2,602 |. 1,885 656 61} £2,602 11-14 1,860 585 50 | 2,495] 1,808 628 59 | 2,495 TotaL | 5,425 | 1,887 176 7,488 | 5,425 | 1,887 176 | 7,488 To calculate the expected numbers the column and row totals are kept constant and the expected number 1732 is given by the product of the corresponding column and row totals divided by the tota](https://iiif.wellcomecollection.org/image/b32176818_0341.jp2/full/800%2C/0/default.jpg)
 No text description is available for this image
 No text description is available for this image
 No text description is available for this image