Sixth report from the Select Committee on Estimates : together with the minutes of evidence taken before sub-committee D and appendices, session 1956-1957: Running costs of hospitals.
- Great Britain. Parliament. House of Commons. Select Committee on Estimates
- Date:
- [1957]
Licence: Public Domain Mark
Credit: Sixth report from the Select Committee on Estimates : together with the minutes of evidence taken before sub-committee D and appendices, session 1956-1957: Running costs of hospitals. Source: Wellcome Collection.
24/448 page 2
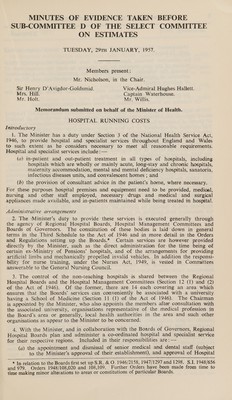
![29 January, 1957.] , [Continued. Management Committees’ staff establishments in broad categories (see para. 24 below) ; (b) the allocation between themselves and their Hospital Management Com- miftees of the sum provided by the Minister to meet the current costs of running the hospitals in their Region, the approval of the Committees’ estimates of expenditure, oversight of current expenditure and follow up of auditors’ reports ; (c) making contractual arrangements with institutions outside the service for the provision of additional beds ; and (d) running the blood transfusion and mass radiography services. 5. In accordance with a scheme approved by the Minister each Regional Hospital Board appoints local Hospital Management Committees, one for each large hospital or group of hospitals forming a reasonable unit for local administrative purposes. The members are appointed by the Board after consultation with any local authority whose area is served by the group, the Executive Council(s) in the area, the senior medical and dental staff in the group and such other organisations as appear to the Board to be concerned. The Committees undertake the day-to-day management of the hospitals on behalf of the Regional Boards. There are in England and Wales 388 Management Committees. 6. The 36 Boards of Governors control the teaching hospitals of the country. The Minister appoints the Chairman and members of each Board of Governors, subject to the nomination of certain proportions of the members by the university with which the hospital is associated, by the Regional Hospital Board and by the teaching staff of the hospital, the remaining members being appointed after con- sultation with such local health authorities and other organisations as appear to the Minister to be concerned. A Board of Governors is responsible directly to the Minister for the management and control of the teaching hospital or hospitals in its group and is required to provide for the university with which the hospital(s) are associated such facilities as appear to the Minister to be required for clinical teaching and research (Section 12 (3) of the Act of 1946). They appoint their own staff, subject to the Minister’s approval of establishment in broad categories (see para. 24 below). 7. Boards and Committees may appoint committees and sub-committees con- sisting wholly or partly of non-members except that the finance committee or sub- committee must consist wholly of members. 8. Service on the Boards and Committees is voluntary and unpaid but provision is made under Regulations made by the Minister to pay for loss of remunerative time and for travelling and subsistence expenses. The staff appointed by the Boards and Committees are not Civil Servants (Section 14 (1) of the Act of 1946). Development of the Service 9. The main figures illustrating the growth of in-patient and out-patient work and showing the numbers of staff employed in the Service are contained in Appendix 1*. Tables 1 and 2 show the number of hospitals, bed complement, average beds available and occupied, discharges and deaths by type of hospital at September, 1956. The classification of hospitals by type is explained in Table 11. As there have been a number of changes in this classification over the years it is not possible to give comparable figures for earlier years; comparable figures for each year from 1949 to 1955 inclusive are, however, given of in-patients by specialty (Tables 3 and 4), out-patients by specialtyj and numbers of amenity and private beds (sections 4 and 5 of the Act of 1946—see para. 10 (b) (iv) and (v) below) (Tables 5 and 6). Tables 7 and 8 show the total numbers of staff employed in each year from 1949 to 1955 inclusive divided into the main sub-divisions, while Tables 9 and 10 give an analysis of nursing staff over the same period according to type of hospitals (though for the reason given above these are not strictly comparable). * App. 1 pp. 355-67. + Table not reported.](https://iiif.wellcomecollection.org/image/b32182466_0024.jp2/full/800%2C/0/default.jpg)
 No text description is available for this image
 No text description is available for this image
 No text description is available for this image