The medical complications, accidents and sequelae of typhoid or enteric fever / By Hobart Amory Hare. With a special chapter on the mental disturbances following typhoid fever. By F. X. Dercum.
- H. A. Hare
- Date:
- 1899
Licence: Public Domain Mark
Credit: The medical complications, accidents and sequelae of typhoid or enteric fever / By Hobart Amory Hare. With a special chapter on the mental disturbances following typhoid fever. By F. X. Dercum. Source: Wellcome Collection.
Provider: This material has been provided by the Augustus C. Long Health Sciences Library at Columbia University and Columbia University Libraries/Information Services, through the Medical Heritage Library. The original may be consulted at the the Augustus C. Long Health Sciences Library at Columbia University and Columbia University.
19/312 (page 21)
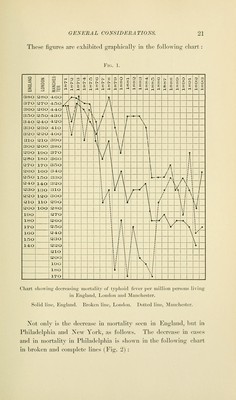
![These figures are exhibited graphically in the following chart: Fig. 1. CD z -a: C3 z UJ CD CD CD 1 OD UJ DZ CD z ce H 00 H 01 X H XX H H 10 00 0 t. X H £ H X N X H is X H 0 X X H H X X H :> X X H CO X X H 4 X X H 0 X X H CO X X H X 00 H X X X H a X X H 0 0 X rl H 0 X H 0 X H M r. i. H 3 SO 280 4GO J A 370 270 -4SO A 360 260 -4-4 O V i / y \ HI i 330 250 43 O 1 v i s X V / r \ r -♦-■ A 340 240 -42 O *l H] 1 / \ / \ V 330 230 -410 \ I \ 1 ', / u/ I / 320 220 400 i \i \v' \ j I 310 210 390 I f! 1 / 1 1 300 200 380 < A \/ 1 290 XOO 370 J V T sso 180 360 V 1 | !l 270 170 350 i A I j 260 160 340 A \ i /' \ l| r 250 150 330 ! 1 A L ■*- J \ A 1! J 240 140 320 ■ / \ A f \ y 1 \ i • / 230 130 UIO 1 .* \ r V \ *' V. \ 220 ISO 300 i - 'i \/ 1 \ / t • / 210 HO 200 * ■ V ) 4 . | y 200 lOO 280 i i \ ! v 190 270 i i i ii ISO 260 i t +* -\ | 170 250 (1 I i > ,• 160 240 h \ ;- 150 230 i i \ 140 220 i | i \ i \ 210 i ; 1 1 ■ 200 \l ■\— lOO if '. / 1 180 i 1 j ! 1 170 i i Chart showing decreasing mortality of typhoid fever per million persona livim in England, London and Manchester. Solid line, England. Broken line, London. Dotted line, Manchester. Xot only is the decrease in mortality seen in England, bul in Philadelphia and New York, as follows. The decrease in eases and in mortality in Philadelphia is shown in the following chart in broken and complete lines ( Fig. '2) :](https://iiif.wellcomecollection.org/image/b21219746_0019.jp2/full/800%2C/0/default.jpg)