Report on a collection of statistics as to the physical condition of children attending the public schools of the School board for Glasgow, with relative tables and diagrams.
- Great Britain. Scottish Education Department
- Date:
- 1907
Licence: Public Domain Mark
Credit: Report on a collection of statistics as to the physical condition of children attending the public schools of the School board for Glasgow, with relative tables and diagrams. Source: Wellcome Collection.
32/84 (page 17)
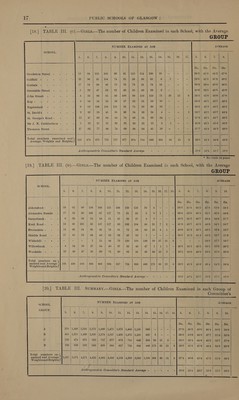
![(18.] TABLE IL. (c).—Girus.—The number of Children Examined in each School, with the Average GROUP NUMBER EXAMINED AT AGE AVERAGE SCHOOL. | 5 6 7 8. 9 10 11 12 13. 14 15. 16 als (5) 6 7 8 | lbs. || tbs. | lbs. | bbe. ] Crookston Street - : = - 13 59 113 108 93 91 113 114 130 35 - - = 38°3 | 41:2 | 44:2 | 47°8 Golfhill M 3 3 co - = 26 | 86 91 104 74 55 56 39 62 9 1 - = 39°5 | 41°3 | 45°9 | 49°2 Gorbals - - - - : : 17 54 56 46 73 76 78 91 79 19 - - - 36'°9 | 39°4 | 43°S | 46°3 Greenside Street - - - -{ 5 | 28 | 47 | 56 | 61.| 46°} 55..| 43 | 388 6 | - = - 40°6 | 39°5 | 44°3 | 45°6 4 John Street - S q < a 4 24 69 85 92 100 98 118 119 75 26 15 8 38°5 | 41°6 | 46°0 | 47°9 Kay - a ° 2 5 . - 8 14 14 22 18 17 22 SL 18 10 - - - 38°3 | 42°1 | 42°7 4. 49°2 Napiershall + - Se) 86 St 2s 00le| bbe tert | Stee ee ee ecb G0 t Ome = ~ | 39-2) 41-9 | 441 | 492 St. David's - - - - - 2 26 18 45 35 36 24 26 24 4 - - 1 38°7 | 42°0 | 43°7 | 484 St. George’s Road - - 5 -f 12 47 63 64 54 74 66 81 63 24 - - = B7°8 | 42°4 | 44°7 | 49-2 Sir J. N. Cuthbertson - - - 5 22 27 31 32 32 24 22 12 2 1 - - 41°6 | 45°1 | 45°4 | 50°5 Thomson Street - - - = | I 62 AG 86 74 69 64 64 41 10 - - - 37°7 | 41°4 | 44°3 | 48°0 pe hered ig oa re eee ta ona 122 | 474 | 675 | 752 | 717 | e77 | 674 | 714 | 646 | 204 | 28 | 15 | 9 | 385 | 41-4] 446 | 492 t |__|} ~ ——— Anthropometric Committee’s Standard Average : Ste hn - = (+ 896 | 49h | 46-7 | 59-2 * No Girls 18 years |19.} TABLE II. (p)—GiIris.—The number of Children Examined in each School, with the Average GROUP NUMBER EXAMINED AT AGE AVERAGE SCHOOL. 5. 6. | Tie 8. ae 10, | a lbs. | lbs. | lbs. | lbs. | lbs. | lbs. | | Abbotsford- — - 3 | 6: 38°3| 41-4 | 442 | 47-8 | 52-9 | 584 | | Alexandra Parade E | : 39'4 | 42°6 | 46-4 | 511] 55°5 | 59°6 | Garnetbank - - 2 : 40°2 | 41°3 | 46°7 | 48:4 | 54°6 | 57:7 | Kent Road - - ‘ : d E : g 41°6.| 42:7 | 45°5 | 48°9 | 54°91 | 58°7 . } Provanside - 3 | 40°6 | 41:3 | 46-1] 49-5 | 534 | 58-7 | Shields Road - y : 38°5 | 41°9 | 448 | 502 | 53°7 | 57-6 | | Whitehill - + | - | = | = | 580) 5r7 | 58-7 | Willowbank : 34 Z é é 40°5 | 41°5 | 45°) | 50°71 | 55°9 | 60°2 | I Woodside - 5 ‘ 381] 40°6 | 46-0 | 50-4 | 55°0 | 60-0 | Total numbers ex- cM elo ou Average | 105 | 9} 39°3 | 41°S | 45°6 | 494) 54°3 | 58-8 | (20.} TABLE III. SummMary.—Giris.—The number of Children Examined in each Group of Committee’s a NUMBER EXAMINED AT AGE i aeioot AVERAGE GROUP. ‘ 6 7 8 9 10 alals 12. 13 14 6 Wie 8 9. 10. | | | lbs. | lbs. | bbs. | Ibs. | Ibs. A 375 } 1,246 | 1,524 | 1,572 1,489 | 1,471 | 1,378 | 1,449 1,185 348 40'0 | 43°0 | 46:4 | 50°56 | 54°8 B 1,215 | 1,469 | 1,520 | 1,574 | 1,527 | 1,450 }1,472 |1,410 | 482 40°6 | 44°0 | 47-7 | 51°9 | 55:8 C 474 675 752 717 677 674 714 646 204 414 | 44°6 48°2 | 52°7 | 57:0 D 436 | 503 568 603 684 617 | 724 698 486 | 41°8 | 45°6 | 49°4 | 54°3 | 58°8 | | | | i EE ee ee. | EM en es oe a ee im a Vrs) Total numbers ex-) . | Weightsand Heights J | | ’ ’ 939 | 1, 0-6 43°9 | 47°5 | 51°9 | 56°1 | |](https://iiif.wellcomecollection.org/image/b32178001_0032.jp2/full/800%2C/0/default.jpg)