Annual report : 1934 / British Hospital for Mothers and Babies Woolwich.
- British Hospital for Mothers and Babies and School for the Higher Training of Midwives (Woolwich, London, England)
- Date:
- 1934
Licence: Public Domain Mark
Credit: Annual report : 1934 / British Hospital for Mothers and Babies Woolwich. Source: Wellcome Collection.
13/32 (page 9)
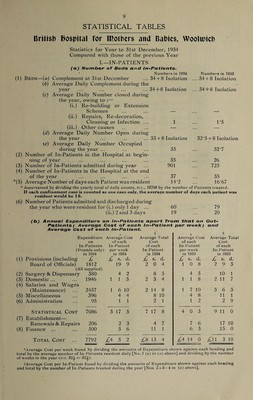
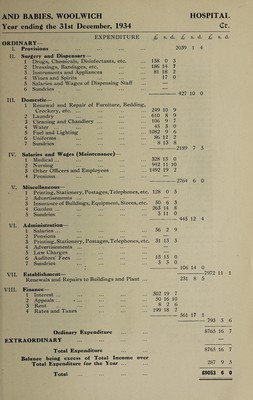
![STATISTICAL TABLES Numbers in 1933 34 + 8 Isolation 34 + 8 Isolation British Hospital tor mothers and Babies, Woolwich Statistics for Year to 31st December, 1934 Compared with those of the previous Year I.—IN-PATIENTS (a) Number of Beds and In-Patients. * Numbers in 1934 (1) Beds—(a) Complement at 31st December ... 34 + 8 Isolation (6) Average Daily Complement during- the year ... ... ... ... 34 + 8 Isolation (c) Average Daily Number closed during the year, owing to :— (i.) Re-building or Extension Schemes ... ... — (ii.) Repairs, Re-decoration, Cleaning or Infection ... 1 (iii.) Other causes .. ... — (d) Average Daily Number Open during the year ye) Average Daily Number Occupied during the year ... (2) Number of In-Patients in the Hospital at begin¬ ning of year (3) Number of In-Patients admitted during year (4) Number of In-Patients in the Hospital at the end of the year *(5) Average Number of days each Patient was resident 14'2 * Ascertained by dividing the yearly total of daily counts, viz., 12798 by the number of Patients treated. If each confinement case is counted as one case only, the average number of days each patient was resident would be 16. (6) Number of Patients admitted and discharged during the year who were resident for (i.) only 1 day ... 60 ... 79 (ii.) 2 and 3 days 19 ... 20 1*5 33 + 8 Isolation 32*5 + 8 Isolation 35 32-7 35 26 901 725 37 35 16-67 (b) Annual Expenditure on In-Patients apart from that on Out- Patients; Average Cost of each In-Patient per week; and Average Cost of each In-Patient. * i * 1 Expenditure Average Cost Average Total Average Cost Average To on of ea ch Cost of each Cost In-Patients In- Patient of each In-Patient of each (Pounds only) per we ek In-Patient per week In- Patient in 1934 n 1934 in 1934 in 1933 n 1933 (1) Provisions (including £ £ S. d. £ s. d. £ s. d. £ S. d. Board of Officials) 1812 19 9 2 0 4 1 0 8 2 9 3 (All supplied) (2) Surgery & Dispensary 380 4 2 8 5 4 3 10 1 (3) Domestic... 1946 1 1 3 2 3 4 1 1 8 2 11 7 (4) Salaries and Wages (Maintenance) 2457 1 6 10 2 14 8 1 7 10 3 6 3 (5) Miscellaneous 396 4 4 8 10 4 8 11 1 (6) Administration 95 1 1 2 1 1 2 2 9 Statistical Cost 7086 3 17 5 7 17 8 4 0 3 9 11 0 (7) Establishment— Renewals & Repairs 206 2 3 4 7 7 6 17 10 (8) Finance ... 500 5 6 11 1 6 3 15 0 Total Cost 7792 £4 5 2 £8 13 4 £4 14 0 £a 3 10 ♦Average Cost per week found by dividing the amounts of Expenditure shown against each heading and total by the average number of In-Patients resident daily [No. 1 (e) in (a) above] and dividing by the number of weeks in the year (viz. 521 or 522.). ■[Average Cost per In-Patient found by dividing the amounts of Expenditure shown against each heading and total by the number of In-Patients treated during the year [Nos. 2 + 3—4 in («) above].](https://iiif.wellcomecollection.org/image/b31685389_0013.jp2/full/800%2C/0/default.jpg)