The vital statistics of Glasgow for 1843 & 1844 : drawn up by appointment and under the authority of the Lord Provost, magistrates, and town council / by Alexander Watt.
- Date:
- 1846
Licence: Public Domain Mark
Credit: The vital statistics of Glasgow for 1843 & 1844 : drawn up by appointment and under the authority of the Lord Provost, magistrates, and town council / by Alexander Watt. Source: Wellcome Collection.
Provider: This material has been provided by the Royal College of Physicians of Edinburgh. The original may be consulted at the Royal College of Physicians of Edinburgh.
31/142 (page 31)
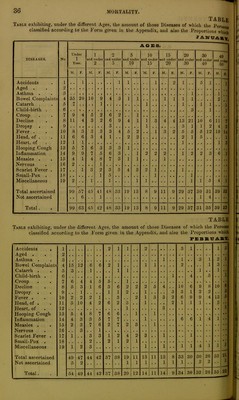
![\ MORTALITY. 31 [IRTEENTII. reported to have Died, at Eighteen Periods of life, during the Month of July, 18-13, bear to the whole number of Deaths during the Month, as well as to the Population. e 4 3. AGES. t TOTAL. O PROPORTIONS. No. 50 | i under 50 60 aud under 70 70 and under 75 75 and under 80 80 and under 85 85 and under 90 90 and under 95 95 and under 100 100. aud Upwards. Hi *d ^ o ] st.—Per centage of the whole Deaths dur- ing the month. 2d.—Per centage of tlie Popifla- tiou. F. M. F. M. F. M. F. M. F. M. F. M. F. M. F. M. F. M. F. 1 1 1 1 1 12 4 10 2-225 0-005 1 # 7 10 8 8 6 8 2 4 0 2 , , , , 2 1 • • . , 31 39 70 9-735 0-023 2 1 , . # 9 2 1 1 7 3 10 1-390 0-003 3 1 48 32 80 11-120 0-020 4 4 3 3 2 1 , , 3 2 1 1 37 40 83 11-543 0-027 5 0 0 0-834 o-ooi 0 5 4 9 1-251 0-002 7 4 04 54 118 10-411 0-038 8 3 1 10 9 19 2-042 0-006 9 6 4 4 1 1 2 1 51 50 101 14-047 0-033 10 1 2 2 24 19 43 5-980 0-014 11 3 1 4 0-550 o-ooi 12 14 17 31 4-311 0-010 13 1 3 . . 1 1 1 20 18 38 5-285 0-012 14 0 6 12 1-608 0-003 15 0 2 8 1-112 0-002 10 11 4 15 2-080 0-004 17 7 8 15 2-080 0-004 18 1 2 3 10 12 28 3-894 0-009 19 18 25 29 12 13 8 14 7 7 8 2 .. 2 1 • • 372 334 700 98-191 0-234 • • 1 1 0 7 13 1-808 0-004 IS I25 30 13 13 8 14 7 7 8 2 2 1 • * 37S 341 719 100-000 0-238 URTEENTH. reported to have Died, at Eighteen Periods of life, during the Month of August, 1843, e bear to the whole number of Deaths during the Month, as well as to the Population. 44 3. ■1 * 1 11 4 15 1-604 0-004 1 11 12 9 4 8 12 S 13 2 4 2 2 2 # , 40 49 89 9-518 0-029 2 1 1 1 0 3 9 0-902 0-002 3 1 1 06 58 124 13-202 0-041 4 9 7 9 4 7 2 2 2 69 80 149 15-935 0-049 5 15 15 1-604 0-004 0 U • • 5 5 10 1-009 0-003 7 4 03 02 125 13-308 0-041 s ,\ 2 2 2 1 9 10 19 2-032 o-ooo 9 9 8 12 1 3 3 1 3 93 84 177 18-930 0‘058 10 3 3 1 34 27 01 6*524 0’020 11 1 3 2 5 0-534 o-ooi 12 14 14 28 2-994 0-009 13 1 1 11 14 25 2-673 0-008 14 . . 8 4 12 1-283 0-003 15 1 1 4 5 0-534 0-001 10 5 3 8 0-855 0-002 17 7 2 9 0-902 0-002 18 3 2 1 1 1 17 10 33 3-529 o-oio 19 1 31 30 38 18 17 13 15 11 10 2 4 2 2 2 , , 402 450 918 98-181 0-304 1 9 8 17 1-818 0-005 • •](https://iiif.wellcomecollection.org/image/b21995266_0031.jp2/full/800%2C/0/default.jpg)