[Report 1950] / Medical Officer of Health and School Medical Officer of Health, Southport County Borough.
- Southport (England). County Borough Council.
- Date:
- 1950
Licence: Attribution 4.0 International (CC BY 4.0)
Credit: [Report 1950] / Medical Officer of Health and School Medical Officer of Health, Southport County Borough. Source: Wellcome Collection.
17/110 (page 15)
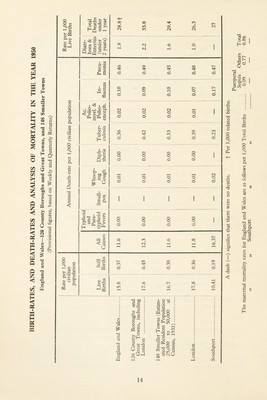
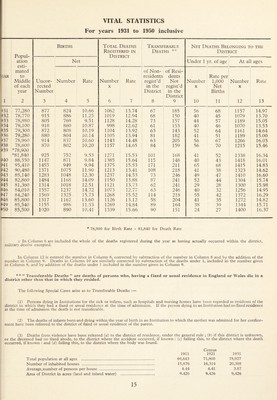
![For years 1931 to 1950 inclusive BAR 1 Popul¬ ation esti¬ mated to Middle of each year 2 Births Total Deaths Registered in District Transferable Deaths ** Net Deaths Belonging to the District 1 Uncor¬ rected Number 3 Net Under 1 ^r. of age At ai] ages Number 4 Rate 5 Number X 6 Rate 7 of Non¬ residents regist’d in the District 8 of Resi¬ dents Not regist’d in the District 9 Number X 10 1 Rate per 1,000 Net ' Births , 11 Number X 12 Rate 13 D31 77,280 877 824 10.66 1062 13.74 67 185 56 68 U57 14.97 B32 78,770 915 886 11.25 1019 12.94 68 150 40 45 1079 13.70 1»33 78,980 805 769 9.51 1128 14.28 73 157 44 57 1189 15.05 !e34 79,100 918 860 10.87 998 12.62 61 153 40 46 1070 13.53 »35 79,300 872 808 10.19 1104 13.92 63 143 52 64 1161 14.64 »36 79,280 880 . 804 10.14 1105 13.94 81 182 41 51 1189 15.00 J)37 78,960 914 837 10.60 1143 14.48 63 205 56 67 1266 16.03 J>38 78,600 870 802 10.20 1157 14.65 84 159 56 70 1215 15.46 J39 *78,900 *81,840 925 752 9.53 1271 15.53 101 168 41 52 1338 16.34 m 88,550 1147 871 9.84 1385 15.64 115 148 40 43 1418 16.01 95,410 1455 949 9.94 1375 15.53 171 211 65 68 1415 14.83 t>42 90,480 1371 1075 11.90 1213 13.41 108 218 41 38 1323 14.62 P43 85,140 1283 1048 12.30 1237 14.53 73 246 49 47 1410 16.60 P44 82,860 1484 1168 14.09 1150 13.88 87 241 52 44 1304 15.74 H5 81,360 1314 1018 12.51 1121 13.73 62 241 29 28 1300 15.98 P46 84,010 1557 1237 14.72 1073 12.77 63 246 40 32 1256 : 14.95 >47 84,240 1569 1325 15.73 1268 15.52 114 218 55 42 , 1372 1 16.29 >48 85,800 1317 1167 13.60 1126 13.12 58 204 41 35 1272 14.82 >49 85,540 1155 986 11.53 1269 14.84 89 164 38 39 1344 15.71 >50 85,500 1020 890 10.41 1339 15.66 90 151 24 27 1400 16.37 * 78,900 for Birth Rate - 81,840 for Death Rate In Column 6 are included the whole of the deaths registered during the year as having actually occurred within the district, military deaths excepted. In Column 12 is entered the number in Column 6, corrected by subtraction of the number in Column 8 and by the addition of the number in Column 9. Deaths in Column 10 are similarly corrected by subtraction of the deaths under 1, included in the number given in Column 8, and by addition of the deaths under 1 included in the number given in Column 9. * * “ Transferable Deaths ” are deaths of persons who, having a fixed or usual residence in England or Wales die in a district other than that in which they resided. The following Special Cases arise as to Transferable Deaths :— (1) Persons dying in Institutions for the sick or infirm, such as hospitals and nursing homes have been regarded as residents of the district in which they had a fixed or usual residence at the time of admission. If the person dying in an Institution had no fixed residence at the time of admission the death is not transferable. (2) The deaths of infants born and dying within the year of birth in an Institution to which the mother was admitted for her confine¬ ment have been referred to the district of fixed or usual residence of the parent. (3) Deaths from violence have been referred (a) to the district of residence, under the general rule ; (b) if this district is unknown, or the deceased had no fixed abode, to the district where the accident occurred, if known : (c) failing this, to the district where the death occurred, if known ; and (d) failing this, to the district where the body was found. Census 1911 1921 1931 Total population at all ages . . 69,643 71,900 78,927 Number of inhabited houses . . 15,676 16,314 20,388 Average.number of persons per house . . 4.44 4.41 3.87 Area of District in acres (land and inland water) . . 9.426 9,426 9,426](https://iiif.wellcomecollection.org/image/b30119947_0017.jp2/full/800%2C/0/default.jpg)