[Report 1930] / Medical Officer of Health, Darlington County Borough.
- Darlington (England). County Borough Council.
- Date:
- 1930
Licence: Attribution 4.0 International (CC BY 4.0)
Credit: [Report 1930] / Medical Officer of Health, Darlington County Borough. Source: Wellcome Collection.
12/150 page 10
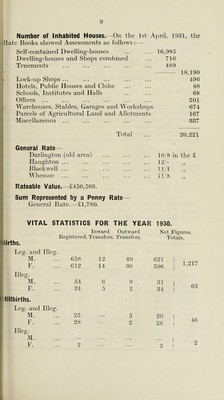
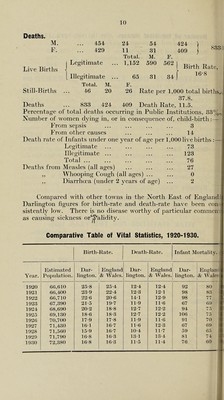
![Deaths. ]() M. F. Live Births 454 429 j Legitimate Illegitimate 24 54 11 31 Total. M. 1,152 590 65 31 424 409 833 F. 562 Birth Rate, 16-8 Still-Births Total. M. F. 46 20 26 Rate per 1,000 total births,. 37.8. Deaths ... 833 424 409 Death Rate, 11.5. I Percentage of total deaths occurring in Public Institutions, 33%. ji Number of women dying in, or in consequence of, child-birth:— From sepsis ... ... ... ... 3 I From other causes ... ... ... 14 Death rate of Infants under one year of age per 1,000 live births :— Legitimate ... ... ... ... 73 Illegitimate ... ... ... ... 123 ^I^ota^l ... ... ... ... Deaths from Measles (all ages) ,, Whooping Cough (all ages) ... ,, Diarrhoea (under 2 years of age) 76 27 0 Compared with other towns in the North East of England Darlington figures for birth-rate and death-rate have been con sistently low. There is no disease worthy of particular commen as causing sickness or^alidity. Comparative Table of Vital Statistics, 1920-1930. Birth-Rate. Death-Rate. Infant Mortality. Estimated Dar- England Dar- England Dar- Englan' Year. Population. lington. & Wales. lington. & Wales. lington. & ^Valej 1920 66,610 25-8 25-4 12-4 12-4 92 80 1921 66,400 23-9 22-4 12-3 121 98 83 1922 66,710 22-6 20-6 141 12-9 98 1^)1^ ! 1 1923 67,390 21-5 19-7 11-9 11-6 67 69 1924 68,690 20-2 18-8 12-7 12-2 94 1 .> 1925 69,130 18-6 18-3 12-7 12-2 106 75 1 1926 70,700 17-9 17-8 11-9 11-6 91 70 ■ 1927 71,430 161 16-7 11-6 12-3 67 69 ' 1928 71,560 15-9 16-7 10-4 11-7 59 65 1929 71,790 16-8 16-3 131 13-4 81 74 1930 72,380 16-8 16-3 11-5 11-4 76 60](https://iiif.wellcomecollection.org/image/b29149125_0014.jp2/full/800%2C/0/default.jpg)