Thirty-fourth annual report of the county and city of Worcester Pauper Lunatic Asylum.
- Worcester Pauper Lunatic Asylum
- Date:
- 1887
Licence: Public Domain Mark
Credit: Thirty-fourth annual report of the county and city of Worcester Pauper Lunatic Asylum. Source: Wellcome Collection.
41/76 (page 41)
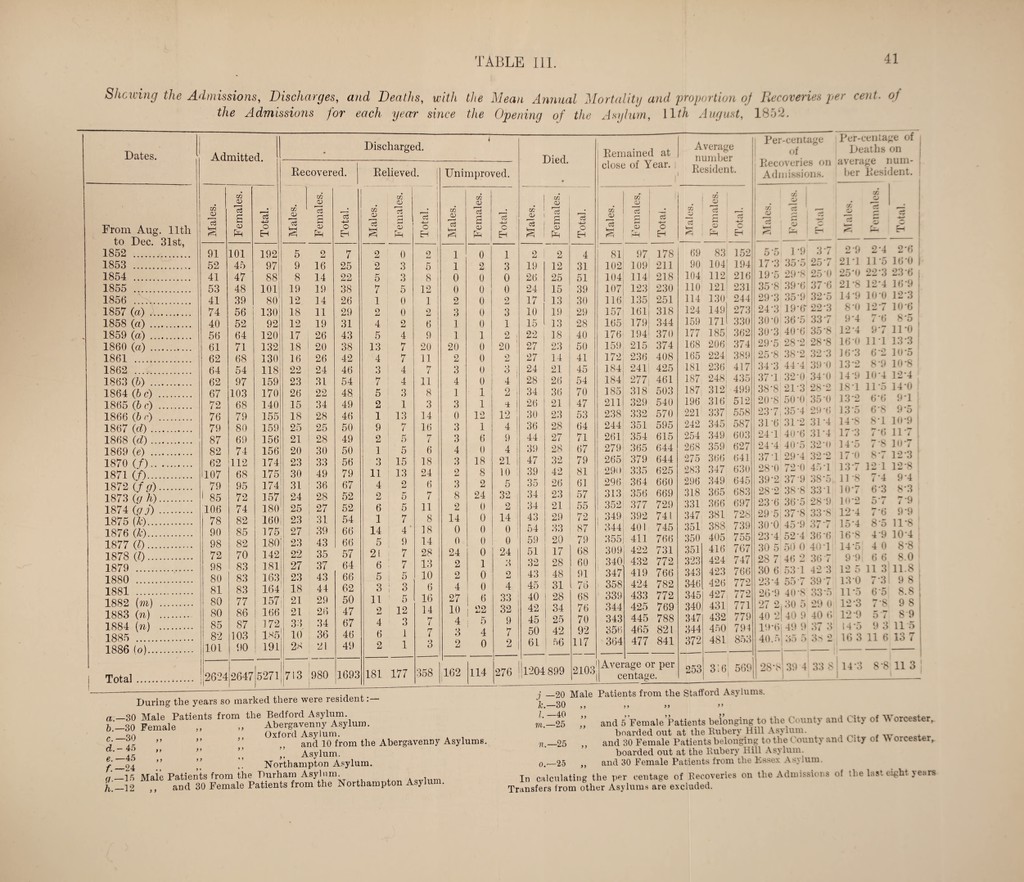
![41 Shelving the Admissions, Discharges, and Deaths, with the Mean Annual Mortalitg and jmportion oj Recoveries ]jer cent, of the Admissions for each year since the Opening of the Asylum, \Dh August, 1852. Dates. From Aug, 11th to Dec. 31st, 1852 . 1853 . 1854 . 1855 . 1856 . 1857 (a) . 1858 (a) . 1859 (a) . 1860 {a) . 1861 . 1862 . 1863 (6) . 1864 {he) . 1865 {he) . 1866 {hr) . 1867 {d). 1868 {d) . 1869 (e) . 1870 (/). 1871 (f). 1872 {fg). 1873 {gh). 1874 {gj) . 1875 [k). 1876 {k). 1877 (0. 1878 (0. 1879 . 1880 . 1881 . 1882 (m) . 1883 {n) . 1884 (n) . 1885 . 1886 (o). Total Admitted. • Discharged. i Recovered. Relieved. Unimproved. Males, Females, Total. Males. Females. Total. Males, Females. i i IS -4—' 1 o H i Males. Females. Total. 1 1 91 101 192! 5 o 7 2 0 o 1 0 1 52 45 97 9 16 25 2 3 5 } 1 2 3 41 47 88' 8 14 22 5 3 8 0 0 0 53 48 101} 19 19 38 7 5 12 0 0 0 41 39 80 12 14 26 1 0 1 2 0 2 74 56 130} 18 11 29 2 0 2 3 0 3 40 52 92[ 12 19 31 4 2 6 1 0 1 56 64 120} 17 26 43 5 4 9 1 1 2 61 71 132} 18 20 38 13 7 20 20 0 20 62 68 130} 16 26 42 4 7 11 2 0 2 64 54 118 22 24 46 3 4 7 3 0 3 62 97 159 23 31 54 7 4 11 4 0 4 67 103 170 26 22 48 5 3 8 1 1 2 72 68 140 15 34 49 2 1 3 3 1 76 79 155 18 28 46 1 13 14 0 12 12 79 80 159 25 25 50 9 7 16 3 1 4 87 69 156 21 28 49 2 ' 5 7 3 6 9 82 74 156 20 30 50 1 5 6 4 0 4 62 112 174 23 33 56 3 15 18 3 18 21 107 68 175 30 49 79 11 13 24 2 8 10 79 95 174 31 36 67 i 2 6 3 2 5 1 85 72 157 24 28 52 ! 2 5 7 8 24 32 106 74 180 25 27 52 6 5 11 2 0 2 78 82 160 23 31 54 1 7 8 14 0 14 90 85 175 27 39 66 14 4‘ 18 0 0 0 98 82 180 23 43 66 5 1 9 14 ' 0 0 0 72 70 142 22 35 57 21 7 28 24 0 24 98 83 181 27 37 64 6 ■ 7 13 2 1 3 80 83 163 23 43 66 5 1 5 10 2 0 2 81 83 } 164 18 44 62 3 i 3 6 4 0 4 80 77 i 157 21 29 50 11 5 16 27 1 ^ 33 80 86 1 166 21 26 47 2 12 14 10 1 22 32 85 87 , 172 33 34 67 4 3 7 4 , 9 82 103 1 P^5 10 36 46 6 1 7 3 4 7 jlOl 90 i 191 24 21 49 2 1 3 2 0 2 1! l26'24 ! j 2647 5271 713 980 1693 181 177 358 ;162 1 114 276 Died. X cLi c3 trl 1^ 19 26 24 17 10 15 22 27 27 24 28 34 26 30 36 44 39 47 39 35 34 34 43 54 59 51 32 43 45 40 42 45 50 6L Remained at close of Year. Average number Resident. Females. Total. Males. Females, Total. cc A Females. c 2 4 81 97 178 69 83 152 12 31 102 109 211 90 104 194 25 51 104 114 218 104 112 216 15 39 107 123 230 no 121 231 13 30 116 135 251 114 130 244 19 29 157 161 318 124 149 273 13 28 165 179 344 159 171 330 18 40 176 194 370 177 185 362 23 50 159 215 374 168 206 374 14 41 172 236 408 165 224 389 21 45 184 241 425 181 236 417 26 54 184 277 461 187 248 435 36 70 185 318 503 187 312 499 21 47 211 329 540 196 316 512 23 53 238 332 570 221 337 558 28 64 244 351 595 242 345 587 27 71 261 354 615 254 349 603 28 67 279 365 644 268 359 627 32 79 265 379 644 275 366 641 42 81 290 335 625 283 347 630 26 61 296 364 660 296 349 645 23 57 313 356 669 318 365 683 21 55 ! 352 377 729 331 366 697 29 72 349 392 741 347 381 728 33 87 ^ 344 401 745 351 388 739 20 79 355 411 766 350 405 755 17 68 309 422 731 351 416 767 28 60 340 432 772 323 424 747 48 91 347 419 766 343 423 766 i 31 76 358 424 782 346 426 772 28 68 339 433 772 345 427 772 34 76 344 425 769 340 431 771 25 70 343 445 788 347 432 779 42 92 356 465 821 344 450 794 1 56 117 364 477 841 372 481 853 899 2103 lAvei c age or per entage. 253 316 569 Per-centage Per-centage of of Deaths on Recoveries ^>n average nuin- , Admissions. l)er Resident. X X ce 5 17 19 35 29 24 30 30 29' 25 34 37 38' 20 23 31 24 24 37 28 39 28 23 29 30 23 30 28 30 23 26 27 40 19 40 5 ] -9 3 35-5 ■5 29-8 8 39-6 3 35-9 3 ]9-6‘- 0 36'5 3 40-6 5 28-2 8 38-2 3 44-4 1 32-0 8 21-3 8 50-0 35 '4 31-2 40-6 40-5 29-4 72-0 2 37-9 2 38-8 6 36’5 5 37-8 0 45-9 4 52-4 5 50 0 7 46 2 6 53 1 4 55-7 '9 40-8 2, 30 5 21 40 9 6i 49 9 51 ;-}5 5 37 257 25 0 37- 6 32-5 22-3 337 35- 8 28-8 32-3 39- 0 34-0 28-2 35 0 29-0 31-4 31- 4 32- (» 32-2 45-1 38- 5. 33 1 28-9 33- 8 377 36- 6 40- 1 .36 4 42 3 397 33-5 29 0 40 6 37 3 3 s 2 X 2-9 21-1 25'0 21-8 14-9 8-0 9-4 12- 4 16 0 16- 3 13- 2 14- 9 18-1 13-2 13- 5 14- 8 17- 3 14- 5 17-0 137 11-8 107 10'2 12-4 15- 4 16- 8 14-5 9-9 12 5 13 0 11- 5 12- 3 12-9 14-5 16 3 2-4 11- 5 22-3 12- 4 lO’O 127 7- 6 97 iri 62 8- 9 10- 4 11- 5 6-6 6‘8 8-1 7 6 7-8 87 12 1 7-4 6- 3 57 7- 6 8- 5 4-9 4 0 6 6 11 3 7-3 6'5 7-8 5 7 9 3 11 6 2-6 16 0 23-6 16-9 12- 3 10-6 8'5 iro 13- 3 10 5 10-8 12-4 14- 0 9-1 9'5 10- 9 117 10 7 12-3 12-8 9-4 8- 3 7- 9 9- 9 11- 8 10-4 8- 8 8.0 11.8 9 8 8.8 9 8 8 9 11 5 13 ■> rr ‘ 4 28-8 39 4 33 8 i 14-3 8 -8 113 During the years so marked there were resident a, —30 Male Patients from the Bedford Asylum. 5.-30 Female ,, „ Abergavenny Asylum. - QA ,, Oxford Asylum. ” ” and 10 from the Abergavenny Asylums. r —45 . ,, ’’ Asylum. _24 ’ ,, •• Northampton Asylum. c/’.—15 Maie Patients from the Durham Asylum A«vlum /[.-12 ,, and 30 Female Patients from the Northampton Asylum. f _20 Male Patients from the Stafford Asylums. L—SO b—40 7/1.—25 ff 99 99 and 5 Female Patients belonging to the County and City of 55 orcester, boarded out at the Rubery Hill Asylum, and 30 Female Patients belonging to the County and City of M orcester, boarded out at the Rubery Hill Asylum, and 30 Female Patients from the Essex Asylum. In calculating the per centage of Recoveries on the Admissions of the last eight j ears Transfers from other Asylums are excluded. 71.—25 0.—25 9 9 99](https://iiif.wellcomecollection.org/image/b30313405_0041.jp2/full/800%2C/0/default.jpg)