Volume 1
Netherlands East Indies / by S.H. Beaver [and others].
- Great Britain. Naval Intelligence Division
- Date:
- 1944
Licence: Public Domain Mark
Credit: Netherlands East Indies / by S.H. Beaver [and others]. Source: Wellcome Collection.
27/626 page 9
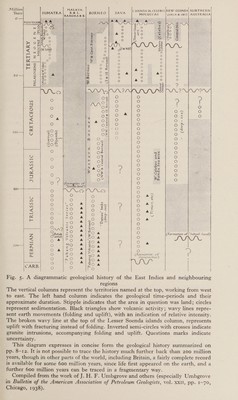
![Million MALAYA, L.SOENDA 15S, CELEBES,|INEW? GUINEA} NORTHERN BORNEO MOLUCCAS arc) 0000 oo000 (Timor Ceram oO O000 a & a a <2 (2) iy ® Zz ww) 1e} OUR o ° < ° le) ° fe) = Oo ) co) fe) = ° oie) 2 ° ce PO e Fs a go th) 3 On me © a GO ° fo) bh 50 Sag fe) (@) %O Vs o «CUA ° xe) O ° 8B Oo ie) e Bo fe) AS S ° So S| Ss ti Sh de 8 aR AN p ) ») O 83 6 S ’ 5 O Co Seabs © 8 5) O on Mien) 2 O < a yo) E O O O BR oO © 5|. © O O ea) 2 oO 100 oe BOS Os Be = U 52 Og O e) eo Bix O ah O O O sce OF 0 O E me oO Oo O er.) Oo O O OF O O eS O O€ O O ”n Oo O Baie: of : ° 5 O Of . Oo Om O oer O °? O : O 150 O EN O A O O O Oo 4Y = O O re ” 5 A OS a / es “ O vO Ons O ° < O One fT Ghy's re: i O FA) a “3 ¢ = S ed i ee S eA oa a e : aloe ge aie CAN? Ou EO 0 (Batak! <2 ais Sahoel-land) a Oarea)| © O CO A oO ss oe ge * rom Ory ee 200] O Or Pe Rong O ~ OC. hla” ZO - O wey O £ Oo A >) «A (Formation o ie A, O e O A ae m Geosyncline) ; a ee ORS x Fig. 5. A diagrammatic geological history of the East Indies and neighbouring regions The vertical columns represent the territories named at the top, working from west to east. The left hand column indicates the geological time-periods and their approximate duration. Stipple indicates that the area in question was land; circles represent sedimentation. Black triangles show volcanic activity; wavy lines repre- sent earth movements (folding and uplift), with an indication of relative intensity. The broken wavy line at the top of the Lesser Soenda islands column, represents uplift with fracturing instead of folding. Inverted semi-circles with crosses indicate granite intrusions, accompanying folding and uplift. Questions marks indicate uncertainty. This diagram expresses in concise form the geological history summarized on pp. 8-12. It is not possible to trace the history much further back than 200 million years, though in other parts of the world, including Britain, a fairly complete record is available for some 600 million years, since life first appeared on the earth, and a further 600 million years can be traced in a fragmentary way. : Compiled from the work of J. H. F. Umbgrove and others (especially Umbgrove in Bulletin of the American Association of Petroleum Geologists, vol. XXU1, pp. I-70, Chicago, 1938).](https://iiif.wellcomecollection.org/image/b3216886x_0001_0027.jp2/full/800%2C/0/default.jpg)




 No text description is available for this image
 No text description is available for this image
 No text description is available for this image