[Report 1970] / Medical Officer of Health, Warrington County Borough.
- Warrington (England). County Borough Council.
- Date:
- 1970
Licence: Attribution-NonCommercial 4.0 International (CC BY-NC 4.0)
Credit: [Report 1970] / Medical Officer of Health, Warrington County Borough. Source: Wellcome Collection.
12/96 (page 12)
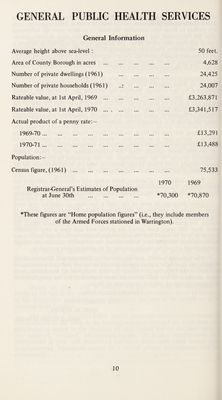
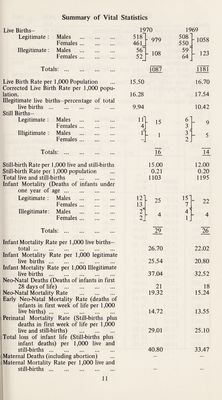
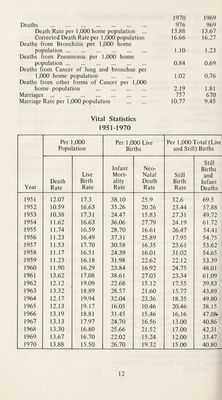
![Dc ii 11] s .». ••• ... *>« «.. *». Death Rate per 1,000 home population ... Corrected Death Rate per 1,000 population Deaths from Bronchitis per 1,000 home population. Deaths from Pneumonia per 1,000 home population. Deaths from Cancer of lung and bronchus per 1,000 home population . Deaths from other forms of Cancer per 1,000 home population . Marriages . Marriage Rate per 1,000 population . 1970 1969 976 969 13.88 13.67 16.66 16.27 1.10 1.23 0.84 0.69 1.02 0.76 2.19 1.81 757 670 10.77 9.45 Vital Statistics 1951-1970 Per 1,000 Population Per 1,000 Live Births Per 1,000 Total (Live and Still) Births Still Infant Neo- Births Live Mort- Natal Still and Death Birth ality Death Birth Infant Year Rate Rate Rate Rate Rate Deaths 1951 12.07 17.3 38.10 25.9 32.6 69.5 1952 10.59 16.63 35.26 20.26 23.44 57.88 1953 10.38 17.31 24.47 15.83 27.31 49.72 1954 11.62 16.63 36.06 27.79 24.19 61.72 1955 11.74 16.59 28.70 16.61 26.47 54.41 1956 11.23 16.49 37.31 25.89 17.95 54.75 1957 11.53 17.70 30.58 16.35 23.61 53.62 1958 11.17 16.51 24.39 16.01 31.02 54.65 1959 11.23 16.18 31.98 22.62 22.12 53.39 1960 11.90 16.29 23.84 16.92 24.75 48.01 1961 13.62 17.08 38.61 27.03 23.34 61.09 1962 12.12 19.09 22.68 15.12 17.55 39.83 1963 13.32 18.89 28.57 21.60 15.77 43.89 1964 12.17 19.94 32.04 23.36 18.35 49.80 1965 12.13 19.17 16.05 10.46 20.46 38.15 1966 13.19 18.81 31.45 15.46 16.16 47.08- 1967 13.13 17.97 24.70 16.56 13.00 40.86 1968 13.30 16.80 25.66 21.52 17.00 42.31 1969 13.67 16.70 22.02 15.24 12.00 33.47 1970 13.88 15.50 26.70 19.32 15.00 40.80](https://iiif.wellcomecollection.org/image/b30235388_0012.jp2/full/800%2C/0/default.jpg)