Census of England and Wales, 1921 : general report with appendices / [General Register Office].
- General Register Office Northern Ireland
- Date:
- 1927
Licence: Public Domain Mark
Credit: Census of England and Wales, 1921 : general report with appendices / [General Register Office]. Source: Wellcome Collection.
57/240 page 41
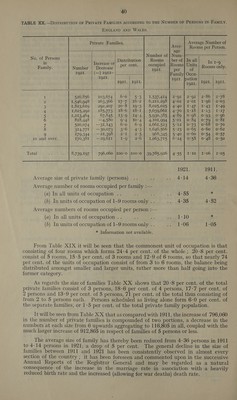
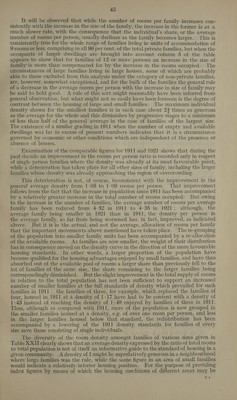
![4] The reduction in the size of families, while it may not abate the demands of individual families for separate dwellings, obviously justifies a review of the general position by reference to the reduced requirements of families in point of accommoda- tion. Accordingly, in any comparison of present housing conditions with those of 1911, it is very necessary, in view of the fact that approximately 20 per cent. of the families occupy a portion only of a structurally separate dwelling each, that changes in the size of the individual occupations should be brought into account. Complete comparisons in respect of this latter fact are not available, owing to the absence of information, for 1911, of the number of rooms in units of occupation of 10 rooms or more ; and such comparisons aS are possible and as are made hereafter, must be understood to be limited to families living in units of occupation of nine rooms or less. These 1911 families, for whom particulars are forthcoming, number 96 per cent. of the total number of families then enumerated, so that their degree of incomplete- ness is hardly likely to be enough seriously to prejudice the comparisons. The tables show that whereas, as already stated, the average size of family has dropped by about 5 per cent., the average unit of occupation has decreased from 4:52 rooms per family in 1911 to 4-35 in 1921, a decline of less than 4 per cent., with the consequence that the average number of occupied rooms per person in the country as a whole has improved from 1-05 in 1911 to 1-06 in 1921. Disregarding, therefore, differences in types of accommodation and size of rooms (on which the census returns are, of course, silent) the population as a whole is, on a general average of rooms per person, rather less densely housed than it was in 1911. The significance of the comparison, however, lies not so much in the amount of the improvement, which is very small, but in the fact that in the face of the widespread housing shortage experienced throughout the country at the present time, present conditions should, on any basis of comparison, appear more favourable than in 1911, when the pressure was certainly less acute than it is to-day. From the following table, which shows for units of occupation of less than 10 rooms, the numbers of persons living under various conditions of room accommodation and the proportion of those numbers to the total population in private families, it will be observed that the slight improvement in the general average density referred to in the previous paragraph has been occasioned mainly by a redistribution of the numbers recorded at the more favourable end of the density scale. TABLE XXI.—POPULATION AND PROPORTION PER CENT. OF POPULATION LIVING UNDER VARIOUS CONDITIONS OF Room ACCOMMODATION, 1921 AND 1911. ENGLAND AND WALES. 1g2I. Igrt. Average number of occupants per room. Population in Private | Population in Private Families. Families. Norahen Proportion Nenher Proportion : per cent. . per cent. $ or less - a se so 3. .. | 3,654,375 Io°l 3,349,229 9°7 Over 4 but less than 1 a vy du: aes] 0,004,314 22°4 ..}, 7,629,070 22:0 x ay a, ie is Fe i: a.) 5,017,374 I6*r .| 5,183,449 15°0 Over 1 but not over 14 o: y b: .. | 8,295,021 22°9 8,026,230 23°2 Pear et ats |. 22 ne Ee R. .. | 5,615,693 15°5 5,501,453 15°9 OR Se PY: 3 73 3 i. .« | 1,734,633 4°8 1,668,580 4°8 AOLe =? Le Se ge tn ea Pe 1,102,521 3°0 955,167 2°8 » 3 butlessthan 4 a ey 4, 3: 316,476 0'9 262,374 0:8 4 and over PE we a ua $3 + 320,659 0-9 253,351 0°7 Population in tenements of over g rooms .. S.5) 1,228,880 3°4 1,777,270 5°1 Tota or mss 7. .- | 36.179,946 I00'0 34,606,173 I00°0](https://iiif.wellcomecollection.org/image/b32183197_0057.jp2/full/800%2C/0/default.jpg)