Departmental report : 2003 / Dept. of Trade and Industry ; presented to Parliament by the Secretary of State for Trade and Industry and the Chief Secretary to the Treasury.
- Great Britain. Department of Trade and Industry
- Date:
- 2003
Licence: Attribution 4.0 International (CC BY 4.0)
Credit: Departmental report : 2003 / Dept. of Trade and Industry ; presented to Parliament by the Secretary of State for Trade and Industry and the Chief Secretary to the Treasury. Source: Wellcome Collection.
23/284 page 21
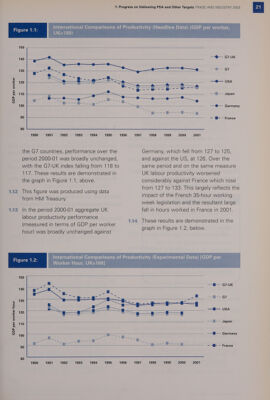
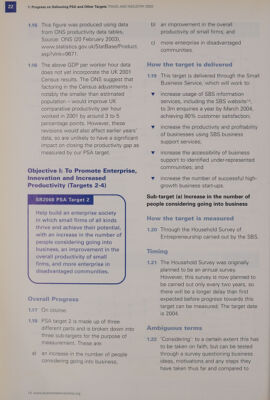
![GDP per worker GDP per worker hour UK=100) 150 ape —®— G7-UK Fh eee oe ee eee Oe @- G7 120 —@®— USA 110 ~ -(§ - - Japan 100 “a ---#--- ~a- gta a rr ee ee BS eek @--» Germany ~ | i -# ia 1990 1991 1992 1993 1994 1995 the G7 countries, performance over the period 2000-01 was broadly unchanged, with the G7-UK index falling from 118 to 117. These results are demonstrated in the graph in Figure 1.1, above. This figure was produced using data from HM Treasury. In the period 2000-01 aggregate UK labour productivity performance (measured in terms of GDP per worker hour) was broadly unchanged against Worker Hour, UK=100] 1996 1.14 - fi- - France 1999 1998 2001 Germany, which fell from 127 to 125, and against the US, at 126. Over the same period and on the same measure UK labour productivity worsened considerably against France which rose from 127 to 133. This largely reflects the impact of the French 35-hour working week legislation and the resultant large fall in hours worked in France in 2001. These results are demonstrated in the graph in Figure 1.2, below. 150 —i-—— G7-UK 140 wanes @-- G7 130 —H— USA 120 ~ -(}- - Japan 110 e aM = a Yea ee #----- Germany os ee --a----i Se > eat 90 = Js {i--- = — + - France](https://iiif.wellcomecollection.org/image/b31849209_0023.jp2/full/800%2C/0/default.jpg)