Reports bringing up the statistical history of the European Army in India and of the Native Army and jail population of Bengal to 1876 : and the cholera history of 1875 and 1876, in continuation of reports embracing the period from 1817 to 1872 / by J.L.Bryden.
- James Bryden
- Date:
- 1878
Licence: Public Domain Mark
Credit: Reports bringing up the statistical history of the European Army in India and of the Native Army and jail population of Bengal to 1876 : and the cholera history of 1875 and 1876, in continuation of reports embracing the period from 1817 to 1872 / by J.L.Bryden. Source: Wellcome Collection.
Provider: This material has been provided by Royal College of Physicians, London. The original may be consulted at Royal College of Physicians, London.
145/358 (page 125)
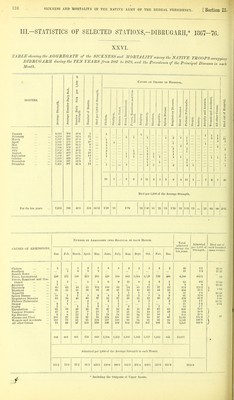
![in-STATISTICS OF SELECTED STATIONS-BAMACKPOIIE, 1867-76. XXV. GENEBAL STATISTICS of SICKNESS and MORTALITY of the NATIVE TROOPS occupyinci BARRACK- PORE in each year of the TEN YEARS from 1867 to 1876. I.-DAILY SICK-EATE OP EACH MONTH OP THE TEN YEARS. YEAR. 1867 1870 1871 1873 1873 1871. 1375 18;6 Ten years, 1867—76 Average Strength of eaeh year and for the period. 953 1,014 826 675 529 707 819 1,011 932 984 Jan. 26-6 50-1 76-4 65-4 67-7 307 58'4 0i>-4 94-1 577 NuMBEB Daily Sick pek 1,000 of Steength. Feb. March. 22-4 48-3 36-3 437 53-3 88-3 63-4 74-6 80-6 68-0 April. 30-3 44-6 SO 3 49-8 6r>-0 95-8 46 9 105-3 56-5 59-8 68-3 May. 17-1 31-8 28-8 45-7 23-0 93 3 336 968 42-1 66-4 49-3 June. 24-9 29-1 35 S 40-6 14-9 79-4 43-4 72-0 4-J-O 49-1 41-1 July. 22 3 29-9 33-0 45-4 29-4 64-9 49-3 63-0 63-0 3ti-4 44-2 Aug. 17-3 36- 8 3S-4 637 37- 9 77-6 39-2 63-6 68-9 62-3 49-( Sept, 15 9 38-7 43-3 48-1 43-4 85-9 43-1 67-4 76-0 70-2 Oct. 38-9 47- 6 49-4 44-3 48- 7 105-9 37-3 74-2 184-8 79-5 71-7 68- 5 69- 4 51-0 60-3 58-2 91-6 65-5 84-4 252-0 67-8 87-6 Dec. 64-5 8S-4 66-5 66-7 28-9 83-1 63-1 100-8 25-0 79-9 II.-COMPOSITION OP THE ADMISSION-RATE OP EACH YEAR, AND OP THE TEN-YEAR PERIOD. Admitted into Hospit.4.l pee 1,000 OE the Avehage Strength itr each Yeae. Admis- sion-rate of each year and of the peiiod. YEAR. Cholera. Intermittent Fevers. Remittent and Continued Fevers. Apoplexy, Dysentery. & s S Hepatitis, Spleen Disease. Respir;itory Diseases. Phthisis Pul- monalis. Dropsy. Scurvy. Rheumatism. Venereal Diseas- es. Eye Diseases. Abscess and Dleer. Wounds and Accidents. All other Causes. 1867 ... 1868 ... 1869 ... 1870 ... 1871 ... 1872 ... 1873 ... 1874 ... 1875 ... 1876 ... 11 4-8 2-4 4-4 1-9 7-1 1-2 3 0 4-3 4-1 400-9 366-8 3-24-5 4949 436-6 S96-7 669-0 1005-9 608-2 1567-0 6-2 n-5 12- 1 13- 3 lg-9 198 12-2 40 26-1 31 1-4 1-3 96-5 116-9 119-9 1200 63-4 118-8 65-9 104-8 1030 186-0 83-9 44-1 15-7 33-6 62- 4 135-8 78- 1 109-8 63- 1 79- 3 1- 1 2- 9 1-2 1- 5 4-2 2- 4 1-0 i'-'o 7-3 77 17 0 4-4 3-8 28-3 14-7 71-2 13<'-2 19-3 26-2 36-4 20-6 69-6 60-5 84-9 .39-1 42-5 35-S 53-9 i'-'9 4-4 3-8 7-1 3-0 2-1 2-1 3-7 4-3 14-4 2- 4 8 9 7-6 43 9 49 14-8 14-1 3- 1 37'8 62-3 36-3 60-8 83-2 83-5 34-3 134-5 23-9 19-3 39-9 56-5 12-1 50-4 37-8 24-0 24-4 41-5 29-3 21-3 4- 3 11-5 3-6 20-7 5- 7 9-9 6- 1 15-8 15-2 14-2 33-0 517 12-1 93-3 52-9 49-5 43-2 63-3 63 9 69-1 73-4 82-4 65 4 IO6-7 102-1 114-5 59-8 168-3 26-1 191-0 89-2 71-8 33-9 11-2-6 109-6 678-9 178-3 329-4 457-7 176-8 903-5 943-6 679-2 1198-5 1049-3 23U8-3 1140-4 2102-8 1590-0 2409-6 Ten years, 1807—76 ... 3-4 635-2 13-4 '2 112-1 69-8 1-6 .32-7 44-9 3-3 ■i 11-3 66-7 34-0 10-9 53-0 98 8 221'6 1462-2 III.—DEATH-RATE OP EACH YEAE AND OP THE PERIOD, AND THE CHIEP CAUSES OP MORTALITY. Died pkk 1.000 op Strength. Causes oe Deaths. A B C Total and 6 3 a YEAR. Deaths. b i ■3 5 Q Cholera. All other Causes. All Causes. -Q > poplc: g S :epatit plcen : cart D ithisis nalis. fopsy. >. B i-'a 0 a other a [0 < 0 m -< < 1867 ... 11-51 ir.54 11 3 4 1 1 1 18H8 ... 3'-'s3 39-70 33-53 35 4 9 1 5 'i 2 5 1 1869 ... 1-21 21-79 23-00 19 1 10 1 3 1 1 2 1 1870 ... 4-44 17-78 32-23 15 3 2 4 1 ] 1 1 1871 ... 1-89 11-34 13-23 7 1 1 1 i i 1 1873 ... 1-41 22-64 24-05 17 1 3 i 1 1 3 2 '3 3 1873 ... 1-23 17-09 18-31 15 1 4 1 1 3 i 1874 ... 3-96 11-87 15-83 16 4 1 8 2 1 1875 ... 2-17 34 71 36 88 34 7 7 12 1 i 1876 ... 5-O8 18-29 23-37 23 5 5 7 'i 1 '3 2 1 Ten years, 1867—76 ... 3-60 20-07 22-67 192 23 45 2 39 19 13 1 10 1 11 17 7 5 IV.—PREVALENCE OP CHOLERA IN EACH MONTH DURING THE TEN YEARS. YEAE. Admissions prom Choleea in each Month or the Ten Years 1867—70. Total Admis- sions. Jan. Feb. March. April. May. June. July. Aug. Sept. Oet. Nov. D9C. 3867 ... 1868 ... 1869 ... 1879 ... 1871 , 1872 ... 1873 ... 1874 ... 1875 ... 1876 ... Ten years, 1867—76 ... '3 i i 1 3 i 'i 3 2 i 1 '2 1 i 1 2 1 i 1 2 1 h 1 4 4 3 1 6 6 1 3 1 4 1 1 29 2h](https://iiif.wellcomecollection.org/image/b24749333_0145.jp2/full/800%2C/0/default.jpg)