Reports bringing up the statistical history of the European Army in India and of the Native Army and jail population of Bengal to 1876 : and the cholera history of 1875 and 1876, in continuation of reports embracing the period from 1817 to 1872 / by J.L.Bryden.
- James Bryden
- Date:
- 1878
Licence: Public Domain Mark
Credit: Reports bringing up the statistical history of the European Army in India and of the Native Army and jail population of Bengal to 1876 : and the cholera history of 1875 and 1876, in continuation of reports embracing the period from 1817 to 1872 / by J.L.Bryden. Source: Wellcome Collection.
Provider: This material has been provided by Royal College of Physicians, London. The original may be consulted at Royal College of Physicians, London.
147/358 (page 127)
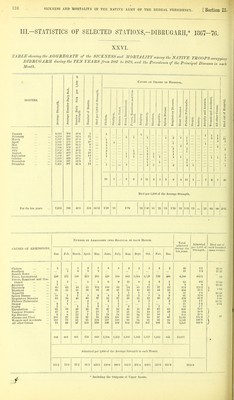
![III.-STATISTICS OF SELECTED STATIONS-DIBRUGAIiH, 1867-76. XXVII. GENERAL STATISTICS of SICKNESS and 3I0ETALITY of the NATIVE TEOOFS occupying DIBBUGAEE in each year of the TEN YEARS from 1867 to 1876. I.—DAILY SICK-RA.TE OP EACH MONTH OF THE TEN YEARS. Aveiapre NcMBEH Daily Sick per ],000 oe Stkength. Average Daily YEAE. Stren^'th of Sick-rate for each year and each year and for the period. Jan. Feb. March. April. May. June. July. Aug. Sept. Oct. Nov. Dec. the period. 1867 ... ... - 1868 ... 913 42-7 47-5 44'6 39-0 46-9 51-3 48-3 52-5 82-1 7110 74-5 53-5 54-8 887 40-1 32-0 24-7 27-2 31-3 39-9 39-0 46-4 3i)-7 40-7 36-5 29-3 35-0 1869 ... 845 36-6 21-4 lC-3 2l>-3 20-0 24-4 31-3 26-3 45-4 61-3 60-6 39-3 33-1 1870 ... 813 36-7 34-4 14-7 17-5 25-3 37-2 57-9 73-5 68-0 60-0 53-4 41-0 43-0 1871 ... 767 41-0 30-5 22-7 28-5 32-8 35-3 30-4 35-6 429 357 43-0 33-1 33-9 1872 ... 689 34-2 25-1 269 37-2 57-3 51-6 41'0 41-8 51-0 49-3 39-4 27-8 4f)-6 1873 ... 739 32-9 33-1 200 19-4 32-4 29'3 29-4 44-0 534 757 38-3 32-4 36-5 1874 ... 723 23-3 21-9 17-5 43-1 39-2 43-3 82-9 103-6 80-2 70-0 93-3 69-3 65-3 1875 ... 702 46-7 66-0 74-7 50-6 47-3 60-3 58-0 58-0 67-2 57'1 54-3 64-8 67-0 1S76 ... 775 47'0 47-1 344 27-5 317 48-7 46-5 37-4 33-6 44-3 50-5 S4-6 40'U Ten years 1867—76 ... 7,853 37-9 34-4 27-8 31-8 36-5 417 46 3 61-5 55-6 56-2 53-9 41-4 42'8 II.—COMPOSITION OP THE ADMISSION-KATE OP EACH YEAR, AND OP THE TEN-YEAR PERIOD. Admitted iitto Hospital per 1,000 op thk Ateea&e Eieength iir each Yeae. YEAR. Cholera. Intermittent Fevers. liemittent and Continued Fevers. Apoplexy. Dysentery. Diarrhoea. Hepatitis. Spleen Disease. Respiratory Dis- eases. ■5 t.- n ■2 2 S Dropsy. Scurvy. Rheumatism. Venereal Dis- eases. Eye Diseases. Abscess and Ul- cer. a . 1 a 0 All other Causes. Admission- rate of each, year and of the period. 8-8 956-1 8-S 1-1 98-7 149-1 2-2 77 57-0 2-2 1-1 4-4 100-9 31-8 17-5 171-0 168-9 207-2 1994-5 2-3 652-8 34 1-1 89-1 90-2 2-3 5-6 39-4 2-3 7-2-1 9 0 21-4 106-0 109-3 155-6 1361-9 9-5 804-7 7-1 1-2 98-2 104-1 9-5 39-1 r'2 3-'4 65-1 5-9 2S-4 78-1 104-1 142-0 1500-6 1-2 883-2 12-3 94-7 46-7 r'2 20-9 75-0 1-2 3-7 r'2 60 3 2-5 18-5 114-4 137-8 119-3 1594-1 1-3 558-0 1-3 99-1 43-0 2-6 13-0 44-3 5-2 3-9 66-1 6-5 33-9 126-5 117-4 118-6 1230-7 5-8 659-0 1-4 lOS-9 116 1 10-2 65 3 4-3 2'-'9 60-9 2-9 16-0 1-29-2 130-6 217-7 1531-2 27 945-8 4-1 82-5 47-4 27 8-1 48-7 43-3 14-9 4-1 89-3 102-9 109-6 1506-1 18-0 1163-2 13-8 134-2 59-5 1-4 13-8 55-3 1-4 l-'4 74-7 48-4 16-6 143-8 125-9 314-4 2085-8 1-4 820-5 11-4 1581 41-3 1-4 27-1 114-0 4-3 132-5 65-5 34-2 198-0 333-3 227-9 2170-9 583-2 2-6 100-0 46-5 2-6 81-3 i-'s 2-6 131-6 27-1 10-3 172-9 150-9 101-9 1474-8 en years, 1867—76 ... 6-1 802-1 6-6 ■4 111-2 76-1 1-4 11-6 61-0 17 1-4 1-7 79-7 20-9 20-1 132-2 146-3 160-4 1B39-9 1867 1868 1869 1870 1871 1872 1873 1874 1875 1876 III.—DEATH-RATE OP EACH YEAR AND OP THE PERIOD, AND THE CHIEP CAUSES OP MORTALITY. Died pee 1.000 OE Causes Stuength. OE UE.VTHS. 0 ■« YEAR. A Cholera. B All other Causes. C All Causes. Tot.al Deaths. Cholera. Fevers. Apoplexy. Dysentery au Diarrhoea. Hepatitis. Spleen DiseaS' Respiratory Di eases. Heart Diseas Phthisis Pu monalis. Dropsy. Scurvy. a g s Violent Deatl 1867 ... 3-29 9-87 13-16 13 3 3 3 1 2 1 1863 ... 1-13 7-89 9-03 8 1 2 3 i i 1 1869 ... 5-92 10-65 16-57 14 5 i 3 1 'i 2 1 1870 ... 12 30 12-30 10 4 1 1. 2 i 1 1871 ... 1872 ... 2-90 13-04 11-61 13- 04 14- 51 10 10 2 1 1 i 1 1 1 1 3 2 1 2 1873 ... 1-35 9-4S 10-83 8 1 2 2 1 i i 1874 ... 8-30 11-06 19-36 14 6 4 2 1875 ... 21-22 24-22 17 1 1 1 li* 1876 ... 14-19 14-19 11 1 1 i i 1 Ten years, 1867—76 ... 2-29 12-33 14-52 114 18 14 1 15 2 1 9 4 12 1 2 10 25 IV.—PREVALENCE OF CHOLERA IN EACH MONTH DURING THE TEN YEARS. YEAR. Admissions eeom Choleea in each Month op the Ten Y'eaes 1867—76. Total Admis- sions. Jan. Feb. March. April. May. June. July. Aug-. Sept. Oct. Nov. Dee. 1867 ... 1868 1869 ... 1870 ... 1871 ... 1872 ... 1873 ... 1874 ... 1875 ... 1876 ... ' ... Ten years, 1867—76 ... i 1 i i 7 i i 5 1 1 3 i 1 i 1 i i 1 1 i 2 i '2 1 1 i 8 2 8 1 1 4 13 1 1 1 g 7 6 4 2 2 5 1 2 40 » Nine of these men were killed by the Nagaa while escorting a Survey Party.](https://iiif.wellcomecollection.org/image/b24749333_0147.jp2/full/800%2C/0/default.jpg)