Reports bringing up the statistical history of the European Army in India and of the Native Army and jail population of Bengal to 1876 : and the cholera history of 1875 and 1876, in continuation of reports embracing the period from 1817 to 1872 / by J.L.Bryden.
- James Bryden
- Date:
- 1878
Licence: Public Domain Mark
Credit: Reports bringing up the statistical history of the European Army in India and of the Native Army and jail population of Bengal to 1876 : and the cholera history of 1875 and 1876, in continuation of reports embracing the period from 1817 to 1872 / by J.L.Bryden. Source: Wellcome Collection.
Provider: This material has been provided by Royal College of Physicians, London. The original may be consulted at Royal College of Physicians, London.
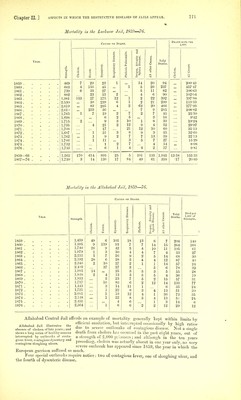
188/358 (page 168)
![Mortality of Jails in Eastern Bengal, to illustrate the high rates clue to the influences endemic in the locality. Backeegttnge. RUNGPOEE. DiNAGEPOHE. Teae. Strength. ■a deaths. mortality. -rate per )0. Strength. •a deaths. mortality. -rate per )0. Strength. ■a deaths, mortality. -rate per )0, Cholei Total g- p Cholei Total Death 1,0( 0 .a Total Death 1,0( 1859 459 22 64 139 4 360 9 74 205-6 730 7 117 160 3 1860 404 12 63 J oo v 300 2 38 126-7 458 17 93 203-1 1861 293 8 30 102 4 293 1 29 990 369 1 21 569 1862 447 8 83 185 9 459 92 200-4 480 33 68-7 1863 570 51 147 257-9 402 43 1070 497 • ■ . 58 116-7 1864 495 17 97 196-0 323 1 28 86-7 462 37 78 168-8 1865 407 1 18 44-2 355 33 930 443 2 42 94 8 1866 • * 380 5 38 100-0 369 3 35 94-8 391 1 36 91-8 1867 434 5 40 92-2 364 41 112-6 403 1 38 94-3 1868 • 522 19 52 996 399 65 162-9 402 1 48 119-4 1869 527 19 62 117-6 391 20 64 163-9 408 1 32 784 1870 393 3 36 91-6 285 35 122 8 348 24 690 1871 443 3 30 67-7 275 18 65-5 349 21 60-1 1872 597 10 77 129-0 251 9 35-9 387 14 36-3 1873 598 6 39 65-2 402 31 77-1 503 15 29-8 1874 481 5 39 81-1 496 2 80 161-3 596 33 53-7 1875 3 JO 6 41 120-6 486 1 60 123-5 522 18 34-5 1876 453 15 64 141-3 537 94 175-1 638 2 27 42-3 1859- 76 8,243 215 1,020 123-7 6,747 16 869 1288 8,386 70 747 891 1859- 67 3,889 129 580 149-1 3,225 23 413 1281 4,233 66 516 121-9 1868- 76 4,354 86 440 101-1 3,522 39 456 129-5 4,153 4 231 55-6 I have chosen the Benares Jail (Table XXXITI), as typical for the jails of the Gangetic How prisoners die in the Gano-etic Provinces. This jail has reduced its death-rate from 76 to 30. Provinces. The Benares Central Jail The proportion which the different causes of mortality bore as a typical example. ^]^g two periods is shown below : '^l^^^T^ ^Etr ^-ers. Phthisis. an^*S°p& APoPl^^y- Hepatitis. iHeart^_ All others. Disease. 18.59—67 1868—76 59-5 5^2 71 4-5 6-3 10-9 5-7 11-2 6-4 5-9 3-4 1-9 11-9= 6-7= a 00 =100 Here, as before, 75 per cent, of the whole mortality is made up of dysentery and diar- rhoea, atrophy, spleen disease, dropsy and phthisis. Deaths and Death-rates of the Benares Central Jail, 13 Years, 1859—76. Causes oe Deaths. Death-eate pee 1,000. YSAB. Strength. 1 Cholera. Smallpox. Fevers. Apoplexy. Dysentery a n d Diarrhoea. Hepatitis. Bespiiatory Dis- eases. Heart Diseases. Phthisis Pulmon- alis. Dropsy, Atrophy aud Spleen Dis- ease. j All other Cauess. Total Deaths. Cholera. All other Causes. All Causes. 1859 . 1.104 3 4 4 76 2 2 6 7 10 114 2-72 100-54 103-26 1860 . 1,176 19 5 5 60 9 7 4 9 118 16-16 84-18 100-34 1861 . 1,397 1 5 83 17 11 8 125 89 48 89-48 1862 . 1,717 l 6 6 106 i 7 6 20 153 -58 88-53 89-11 1863 1,412 44 5 70 12 7 2 20 160 31-16 82-86 114 03 1864 . 1,306 26 2 33 6 19 2 13 102 19-91 78-19 98-10 1865 . 1,193 1 8 3 19 i 2 6 7 47 •84 38 56 39-40 1S66 . 1,170 11 2 10 i i 1 3 4 33 28-21 28 21 1867 . 1,240 10 15 1 2 3 2 4 37 29-84 29-84 1868 . 961 1 10 30 2 1 4 48 i-'64 4891 49-95 1869 . 1,157 3 8 ' 1 12 i { 3 1 1 31 26-79 26-79 1870 . 1,286 3 10 2 1 6 2 24 18-66 18-66 1871 . 1,118 1 36 4 4 1 4 50 44-72 44-72 1873 . 1,266 5 1 25 10 9 8 53 3-'95 37-91 41-86 1873 . 1,501 2 i 48 2 7 4 64 4264 42 64 1874 . 1,757 3 27 6 5 2 2 45 25-61 25-61 1875 . 1 1,895 13 3 9 2 1 4 4 35 18-47 18-47 1876 . 1,845 1 2 22 1 4 2 3 35 18-97 18-97 1859—76 . 24,501 100 4 91 34 691 6 73 3 87 65 120 1274 4-08 47-91 52-00 18.59-67 . 11,715 94 1 50 27 472 1 56 1 45 43 95 889 8-02 67-87 75-89 1868—76 . 12,78f 6 3 41 7 219 5 17 2 42 22 25 385 -47 29-64 30-n](https://iiif.wellcomecollection.org/image/b24749333_0190.jp2/full/800%2C/0/default.jpg)