Reports bringing up the statistical history of the European Army in India and of the Native Army and jail population of Bengal to 1876 : and the cholera history of 1875 and 1876, in continuation of reports embracing the period from 1817 to 1872 / by J.L.Bryden.
- James Bryden
- Date:
- 1878
Licence: Public Domain Mark
Credit: Reports bringing up the statistical history of the European Army in India and of the Native Army and jail population of Bengal to 1876 : and the cholera history of 1875 and 1876, in continuation of reports embracing the period from 1817 to 1872 / by J.L.Bryden. Source: Wellcome Collection.
Provider: This material has been provided by Royal College of Physicians, London. The original may be consulted at Royal College of Physicians, London.
232/358 page 212
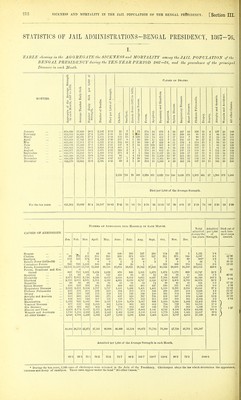
![313 STATISTICS OF JAIL ADMINISTMTIONS-BENGAL PRESIDENCY, 1867-76. I. TABLE sJimvinci in the AGGREaATE the SICKNESS and MORTALITY among the JAIL POPULATION of the BENGAL PRESIDENCY during the TEN-YEAR PERIOD 1867—76, and the prevalence of the principal Diseases in each Month. Stren '6. 1,000 Causes op Deaths. CJ GO o 2 ° 'Si >> a 8 MONTHS. •egate of the Av each Month, 1867 age Number Dail bcr Daily Sick •eugth. ber ot Deaths. per 1,000 of Stre - u o c ric Fever (1872 to agious Fevers. ft 3 •a a >> g .titis. !n Disease. iratory Diseases. t Diseases. isis Pulmonalis. >, >, t> a 8 a < a rt >i P, ads and Accidents ther Causes, &a Q > is B a % 'o a ont o ft ■& p. 3 p< o u ^1 s o p 3 O o < < ^ s w a o ft < « W CO S, W Q 03 < < January 618,526 17,649 28-5 2,185 3-53 21 7 1 73 174 14 872 5 22 447 10 126 51 4 137 26 189 February 619,518 16,920 27-3 1,538 2-48 51 12 1 too 124 16 518 5 16 299 10 88 45 4 89 20 140 March 617,007 16,891 27-4 1,505 2-44 156 10 4 129 145 14 412 7 17 253 7 98 31 3 84 24 111 April 618,933 17,762 28-7 1,522 2-46 237 8 1 66 168 11 452 7 15 195 13 98 27 2 73 33 116 M ay 622,081 17,314 27-8 1,522 2-45 241 10 2 30 169 47 426 9 11 176 4 114 25 1 93 33 128 .June 630,776 17,066 27-1 1,395 2-21 137 8 2 11 128 133 387 9 17 157 13 120 26 1 85 32 129 July 638,800 18,231 28-5 1,620 2-54 401 5 1 114 33 495 8 16 119 13 103 27 1 81 35 139 August 643,977 22,053 34-2 2,071 3-22 360 3 4 i 170 18 852 11 25 137 13 119 35 3 132 38 150 September 618,078 24,690 38-1 2,468 3-81 271 2 2 1 244 15 1.197 19 18 189 17 107 38 9 132 34 173 October 615,448 25,753 39-9 2,780 4-31 95 4 14 344 24 1,429 12 37 255 20 125 52 9 138 37 185 November 610,329 23,779 37-1 2,990 4-67 117 i 3 20 340 15 l,4fi5 10 25 324 22 119 54 9 179 35 222 December 632,170 19,955 31-6 2,791 4-41 69 3 1 48 214 11 1,330 8 29 455 24 137 54 11 165 26 206 2,159 ■;69 26 493 2,334 351 9,835 110 248 3,036 172 1,383 465 57 1,388 373 1,888 Died per 1,000 of the Average Strength For the ten year8 631,303 19,839 31-4 24,387 38-63 3'42 ■11 ■04 ■78 3^70 ■50 15-58 ■17 ■39 4^81 ■27 2^19 ■74 ■09 2^20 ■59 2-99 NUMBBB OP Admission's iifTo Hospital iw EACH Month. Total Admitted Died ont of CAUSES OP ADMISSIONS. admitted per 1,000 each hun- during the of dred cases ten years. Strength. treated. Jan. Feb. Mar. April. May. June. July. Aug. Sept. Oct. Nov. Dec. Dengue 1 44 80 146 163 247 299 114 22 5 1,121 1-8 Cholera '63 ^3 453 553 565 329 974 819 527 211 275 140 5,097 8-1 42-35 Smallpox 118 123 174 181 150 85 19 10 7 7 40 69 986* 1-6 7-00 Enteric Fever (1872—76) 2 5 6 9 5 2 6 3 7 5 3 56 •1 46-13 Contagious Fevers 348 763 1,009 589 206 86 20 1 323 169 134 3,651 6-8 13-50 Fevers, Intermittent 13,503 11,556 13,719 15,999 16,516 15,618 19,921 31,342 37,'903 40,044 28,608 18,289 263,012 416-6 Fevers, Remittent and Con. 0 1 -85 tinued 669 760 1,005 1,058 1,026 876 945 1,181 1,675 1,674 1,179 699 12,747 20-2 Apoplexy 13 22 19 21 147 410 88 21 19 29 23 11 823 1-3 42-65 Dysentery 4,071 2,912 3,730 4,343 4,052 4,058 6,012 8,665 8,097 7,164 6,647 5,597 65,348 103-5 Diarrhosa 3,116 3,005 4,931 5,284 4,590 4,691 6,039 6,767 5,640 4,740 4,404 3,769 56,976 90-2 1 8-01 Hepatitis 49 49 49 56 61 45 58 53 74 49 45 43 631 1-0 17-43 Spleen Disease 450 339 323 382 395 369 443 405 437 530 521 482 5,076 8-0 4-89 Eespiratory Diseases 2,882 2,413 2,084 1,767 1,757 1,481 1,426 1,401 1,405 1,818 2,-291 2,916 23,641 37-4 12-84 Phthisis Pulmonalis 233 193 218 232 228 234 203 174 186 228 243 254 2,626 4-2 52-67 Dropsy 166 118 132 113 143 135 145 140 150 165 154 1.89 1,750 2-8 26-57 Atrophy aud Aufemia 810 568 518 565 571 637 820 767 738 832 867 876 8,569 13-6 16-20 Scurvy 106 105 140 107 131 133 178 182 255 259 238 165 2,004 3-2 2-8-1 Bheumatism 1,093 926 1,061 990 1,037 1,108 1,079 1,017 996 1,024 1,065 1,006 1-2,102 196 Venereal Diseases 877 832 956 1,003 981 1,034 961 921 852 794 729 701 10,701 170 Eye Diseases 359 393 647 902 947 764 812 847 839 734 572 383 8,199 130 Abscess and Ulcer 4,969 4,774 5.057 5,175 5,612 6,77-2 7,229 6,005 5,141 4,742 4,196 4,334 64,036 101-4 1 1-37 Wounds and Accidents 1,738 1,885 2,292 2,421 2,-413 2,462 2,516 2,156 2,102 1,779 1,648 1,665 25,007 39-6 All other Causes ... 4,849 4,794 5,449 5,362 5,317 5,016 5,081 4,945 4,400 4,113 3,787 4,015 57,128 90-5 40,484 36,713 43,972 47,161 46,994 46,499 55,134 68,072 71,745 71,380 57,728 45,705 031,587 Admitted per 1,000 of the Average Strength in each Month, 65- 5 59- 3 71- 3 76-2 j 75-6 73-7 863 105-7 110-7 110-6 90-2 72-3 1000-5 * During the ten years, 3,249 cases of chicken]iox were returned in the Jails of the Presidency. Chickenpox obeys the law which determines the appearani'C, increase and decay of smallpox. These eases appear under the head All other Causes.](https://iiif.wellcomecollection.org/image/b24749333_0234.jp2/full/800%2C/0/default.jpg)


 No text description is available for this image
 No text description is available for this image
 No text description is available for this image