Reports bringing up the statistical history of the European Army in India and of the Native Army and jail population of Bengal to 1876 : and the cholera history of 1875 and 1876, in continuation of reports embracing the period from 1817 to 1872 / by J.L.Bryden.
- James Bryden
- Date:
- 1878
Licence: Public Domain Mark
Credit: Reports bringing up the statistical history of the European Army in India and of the Native Army and jail population of Bengal to 1876 : and the cholera history of 1875 and 1876, in continuation of reports embracing the period from 1817 to 1872 / by J.L.Bryden. Source: Wellcome Collection.
Provider: This material has been provided by Royal College of Physicians, London. The original may be consulted at Royal College of Physicians, London.
234/358 page 214
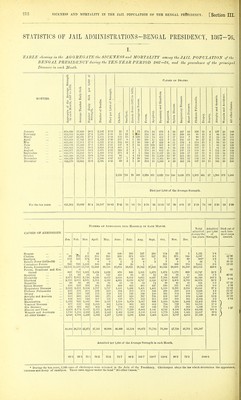
![STATISTICS OF JAIL ADMINISTEATIOWS-BENGAL PROPER, 1867-76. III. TABLE slioioivg in the AGGREGATE flie SICKNESS and MORTALITY in the JAIL POPULATIOISI inducleA under the ADMINISTRATION of BENGAL PROPER during the TEN-YEAR PERIOD 1867^76, mid the prevalence of the principal Diseases in each Month. [Assam, wliich was recently placed under separate administration, is included in this Statement.] a 'o tc c: i,ono ClUSES OP Deaths. O I-- o C MONTHS. Avera 67 to 1 'rt O Siek Streng 72-76 arrhcEi ci s o c II Sec; be ^ < Average Number Number Daily Strength. Number of Death Died per 1,000 of Cholera. Smallpox. Enteric Fever (18 > Apoplexy. Dysentery and Di Hepatitis. Spleen Disease. O 5 o 'S. (§ Heart Diseases. Phthisis Pulmono c p e\ Scurvy. Atrophy and Ante Wounds and Acei All other Causes. January... 192,420 6,746 35-1 761 3-95 21 5 48 5 354 1 12 87 6 64 43 1 6G 9 50 February 192,802 6,485 33-6 603 313 23 3 1 30 10 254 1 10 79 5 52 34 1 39 8 65 March ... 192,564 6,658 34-6 675 351 134 3 4 48 5 238 4 8 67 4 54 23 2 41 13 27 April 193,261 7,059 36-.5 806 4-17 218 4 1 68 8 240 2 10 62 7 67 19 1 43 9 47 May 195,203 6,772 34-7 772 3-95 214 5 2 45 5 248 5 5 67 2 68 19 1 39 14 43 June 198,107 6,759 34-1 680 3-43 108 4 1 39 10 246 4 9 52 7 74 20 1 44 14 47 July 198,968 7,603 38-2 894 4-49 287 4 45 4 307 2 11 60 5 61 17 45 10 46 August ... 198,481 8,273 41-7 992 6-00 192 i 61 11 447 4 6 56 6 68 25 2 56 8 66 September 197,964 8,295 41-9 1,014 6-12 163 2 1 69 10 481 9 10 62 10 48 25 1 64 11 58 October 196,849 8,189 41-8 991 5-06 52 3 76 11 652 7 15 69 11 67 28 1 43 la 44 November 195,267 8,201 42-0 1,067 5-46 91 1 1 83 5 625 2 14 80 9 72 31 5 63 12 73 December 193,757 7,431 38-4 966 4-98 64 1 60 2 473 5 20 100 7 69 32 4 58 10 61 1,567 32 18 672 86 4,365 46 130 821 78 741 316 20 591 128 607 Died per 1,000 of the Average Strength. For the ten years 195,386 7,372 37-7 10,221 52-31 8-02 •16 •09 3-44 ■44 22-34 -24 -67 4-20 -40 3-81 1-62 -10 3-02 ■65 3-11 NuMBEE or Admissions into Hospital in each Month. Total Admitted Died out of admitted CAUSES OF ADMISSIONS. per 1,000 of eachi hundred during the ten years. Strength. eases treated. Jan. Feb. Mar. April. May. June. July. Aug. Sept. Oct. Nov. Dec. Dengue 1 44 80 145 160 158 43 62 18 5 718 3^6 Cholera 62 89 400 520 477 265 731 440 353 105 231 133 3,806 19-6 41-17 Smallpox 22 26 43 51 56 38 11 3 4 4 6 19 283 1-4 11-31 Enteric Fever (1872—70) 2 4 4 3 3 2 5 3 4 2 1 33 5-1 54 Fever, Intermittent 5,561 4,890 5,931 6,302 5,929 6,048 8,242 9,504 8,983 10,243 9,897 7,350 88,880 454-9 Fevers, Remittent and Con- tinued 266 270 355 344 329 333 446 407 552 499 438 274 4,603 23-8 76-11 Apoplexy 5 12 5 11 9 22 4 10 U 11 8 6 113 -6 Dysentery 2,041 1,646 2,179 2,628 2,421 2,519 3,646 4,068 3,760 3,160 2,929 2,645 33,642 172-2 1 6-73 Diarrhoea 1,609 1,773 3,181 3,203 2,723 2,853 3,508 3,164 2,773 2,421 2,120 1,846 31,174 159-5 Hepatitis 28 25 21 20 31 22 28 22 4] 20 25 25 308 1-6 14-93 Spleen Disease 238 208 185 218 225 188 294 233 236 256 246 259 2,786 14-3 4-67 ! Respiratory Diseases 711 698 670 578 6-18 548 528 575 682 680 672 793 7,683 39-3 10-69 Phthisis Pulmonalis 124 115 136 128 131 135 108 90 92 136 146 139 1,480 7-6 50-27 Dropsy 131 91 93 87 109 111 122 112 110 119 ■ 108 ■ 145 1,314 6-9 23-51 Atrophy and Anasmia 296 259 279 290 272 326 533 435 395 417 448 378 4,328 22-1 13-er. Scurvy 66 61 70 62 77 96 130 111 103 116 174 102 1,168 6-0 1-71 Bheumatism 540 459 529 487 511 5-14 519 494 462 484 541 498 6,068 31-1 ■Venereal Diseases... 335 332 375 399 353 402 363 368 347 275 291 302 4,142 21-2 Eye Diseases 114 125 163 177 180 191 223 229 213 222 160 120 2,107 10-8 1 1-36 Abscess and Ulcer 1,113 1,125 1,187 1,206 1,205 1,280 1,3-14 1,165 1,112 1,010 844 947 13,538 69-3 Wounds and Accidents 589 673 766 767 761 768 783 711 673 626 649 569 8,235 42 1 All other Causes ,.. 2,501 2,476 2,618 2,446 2,423 2,083 2,043 1,951 1,900 1,809 1,677 1,888 25,815 132-1 16,352 15,3.55 19,191 19,972 18,953 18,920 23,768 24,487 22,612 22,679 21,520 18,443 242,252 Admitted per 1,000 of the Average Strength in each Month. 86-0 79-0 99-7 103-3 97-1 96-6 119-5 123-4 114-2 115-8 110-2 95-2 1239-9](https://iiif.wellcomecollection.org/image/b24749333_0236.jp2/full/800%2C/0/default.jpg)


 No text description is available for this image
 No text description is available for this image
 No text description is available for this image