Reports bringing up the statistical history of the European Army in India and of the Native Army and jail population of Bengal to 1876 : and the cholera history of 1875 and 1876, in continuation of reports embracing the period from 1817 to 1872 / by J.L.Bryden.
- James Bryden
- Date:
- 1878
Licence: Public Domain Mark
Credit: Reports bringing up the statistical history of the European Army in India and of the Native Army and jail population of Bengal to 1876 : and the cholera history of 1875 and 1876, in continuation of reports embracing the period from 1817 to 1872 / by J.L.Bryden. Source: Wellcome Collection.
Provider: This material has been provided by Royal College of Physicians, London. The original may be consulted at Royal College of Physicians, London.
238/358 page 218
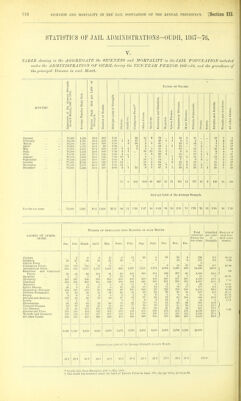
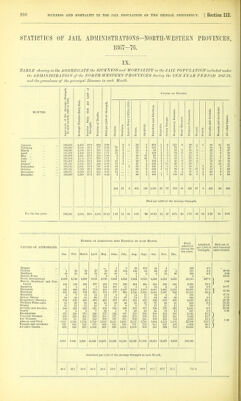
![STATISTICS OF JAIL ADMINISTRATIONS-CENTRAL PROVINCES, 18G7-76. VII. TABLE sJiowmg in the AGGREGATE the SICKNESS and MORTALITY in the JAIL POPULATION included under the ADMINISTRATION of the CENTRAL PROVINCES during the TEN-YEAR PERIOD 1867-76 and the prevalence of thepri7j,cipal Diseases in each Month, 5 S) a 1,000 of Causes of Deaths. o &2 P. 00 ci S o c 8 MONTHS. he Avei 1867 ti jer Dail 1 Sicli ;aths. of stre (1872 to t- 3 iscases. rt a 0 a a ccident °a S 3 Q o o o and 0 >, s 3 < ■a •a 3 o o 3 rt p verage umber Streng umber ied per holera. niallpo: nteric ] overs. poplex; ysenter epatiti; pleen I espirat eart D hthisis ropsy. !urvy. >) .a Qi 0 -S 3 0 .1 other < < fi o <) O a P3 a Q January 33,442 1,497 44 8 110 3-29 7 2 55 1 13 1 1 1 1 11 17 February 33,642 1,362 40 5 76 2-26 7 35 1 10 1 3 2 3 9 i 4 March 33,370 1,307 39 2 80 2-40 6 12 i 20 1 1 17 3 1 1 9 8 April 33,327 1,259 37 8 66 1-98 2 13 20 10 2 2 1 1 5 '5 5 May 33,387 1,258 37 7 58 1-74 6 18 3 12 i 9 2 5 2 June 33,846 1,228 36 3 55 1-62 12 4 6 19 3 2 5 5 July 34,086 1,297 38 1 95 2-78 32 2 27 6 2 8 i 17 August 34,079 1,590 46 7 130 3-81 19 r 59 4 9 2 i i 16 2 12 15 September 34,313 1,841 63 7 165 4-81 3 13 91 4 12 i 4 2 6 11 3 October 34,329 2,003 68 3 169 4-92 2 1 17 86 1 2 11 2 1 7 5 .12 3 19 November 33,789 1,875 65 5 167 4-94 10 i 81 2 2 18 3 4 1 3 22 3 17 December ... ... 33,290 1,590 47 8 141 4-24 i 9 76 a 14 2 2 5 3 10 2 15 83 1 117 12 681 12 10 132 14 26 21 24 123 20 136 For the ten years Died per 1,000 of the Average Strength. 33,742 1,509 44-7 1,312 38.88 2-46 •03 3-47 •36 17-22 •36 .•30 3-91 ;'4i •77 •62 ■71 3-Gl •59 4-03 CAUSES OF ADMIS- SIGNS. NuMBEE OF Admissions into Hospitai in each Month. Total admitted during the tea years. Admitted per 1,000 of Strength. Died out of each hun- dred cases treated. Jan. Feb. March. April. May. June. July. Aug. Sept. Oct. Nov. Dec. Cholera 1 7 2 7 22 72 27 3 2 1 141 4-3 57-64 Smallpox 1 2 5 1 2 1 1 13 •4 Enteric Fever 2 2 •1 Fever, Intermittent 1,217 1,045 1,098 1,101 1,063 '933 1,243 1,744 2,534 2,796 2','658 1,373 18,210 539-7 Fevers, Remittent and Con- 1 -62 tinued 26 37 51 66 65 37 40 32 43 62 45 21 495 14-7 Apoplexy 1 3 2 10 0 1 1 24 -7 60-00 Dysentery 261 204 234 169 195 247 484 704 468 351 384 307 3,998 118-5 Diarrhoea 194 128 166 187 204 199 399 462 310 240 209 172 2,859 84-7 1 8-47 Hepatitis 3 1 1 3 4 2 4 5 4 4 1 32 -9 37-50 Spleen Disease .. 15 10 10 12 18 9 10 19 11 26 25 20 185 6-5 6-41 Respiratory Diseases 166 154 158 165 128 90 119 117 102 146 163 151 1,649 48-9 8-00 Phthisis Fulmonalis 6 1 5 1 2 3 1 3 5 4 4 2 37 1-1 70-27 Dropsy 3 1 2 2 2 1 2 2 8 6 5 34 1-0 61-76 Atrophy and Ancemia 37 31 30 21 30 '27 20 29 40 47 80 41 433 12-8 28-41 Scurvy 3 11 26 5 6 16 23 60 33 21 23 232 6-9 10-34 Rheumatism 111 92 103 114 134 111 102 103 97 100 106 103 1,276 37-8 Venereal Diseases 70 76 66 60 76 78 66 56 64 63 43 61 759 22-5 Eye Diseases 25 30 42 70 66 55 76 70 59 88 45 24 639 I8-9 Abscess and Ulcer 632 641 604 578 722 823 757 694 096 756 616 606 7,925 234-9 1 1-08 Wounds and Accidents 138 114 147 137 152 1« 160 112 140 101 82 123 1,550 45-9 All other Causes 308 276 320 273 318 284 311 346 283 294 263 267 3,543 105-0 3,204 2,757 3,077 2,947 3,177 3,084 3,879 4,537 4,922 5,108 4,156 3,191 44,039 Admitted per 1,000 of the Average Strength in each Month. 95-8 82-0 92-2 88-4 95-2 911 113-8 133-1 143-4 148-8 123-0 95-9 1305-2](https://iiif.wellcomecollection.org/image/b24749333_0240.jp2/full/800%2C/0/default.jpg)

 No text description is available for this image
 No text description is available for this image
 No text description is available for this image