Reports bringing up the statistical history of the European Army in India and of the Native Army and jail population of Bengal to 1876 : and the cholera history of 1875 and 1876, in continuation of reports embracing the period from 1817 to 1872 / by J.L.Bryden.
- James Bryden
- Date:
- 1878
Licence: Public Domain Mark
Credit: Reports bringing up the statistical history of the European Army in India and of the Native Army and jail population of Bengal to 1876 : and the cholera history of 1875 and 1876, in continuation of reports embracing the period from 1817 to 1872 / by J.L.Bryden. Source: Wellcome Collection.
Provider: This material has been provided by Royal College of Physicians, London. The original may be consulted at Royal College of Physicians, London.
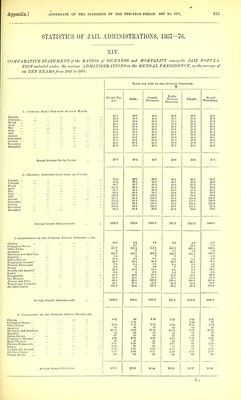
243/358 (page 223)
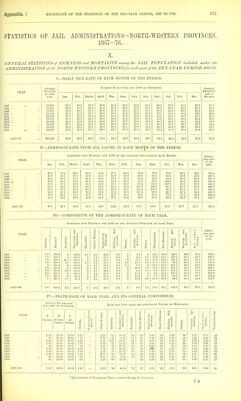
![STATISTICS OF JAIL ADMINISTMTIONS-PUNJAB, 1867-76. XII. GENERAL STATISTICS of SICKNESS and MORTALITY among the JAIL POPULATION included under the ADMINISTRATION of the PUNJAB for each year of the TEN-YEAR PERIOD 1867—76, I.—DAILY SICK-ItATE OF EACH MONTH OP THE PEllIOD. Averagre NuiiEEB D.vitT Sick pee 1,000 of Strength. Average YEAR. Strength of Daily Sick- each year. Jan. Feb. March. April. May. June. July. Aug. Sept. Oct. Not. Dec. rate of the year. 1867 ... 1868 ... 10,506 17-6 16-6 20-7 29-8 31-8 23-9 22-2 23-8 52-6 43-4 32-9 20-8 28-1 11,056 19-0 18-4 18-2 19-3 22-7 19-8 18-2 21-3 23-2 27-6 3U-8 26-7 23-1 1869 ... 1?,381 23-3 22-0 31-2 27-4 22-2 21-8 20-7 29-6 35-4 58-4 56-5 31-2 31-8 1870'... 12,785 28-5 32-2 2.3-0 24-5 24-4 21-0 20-5 25-6 36-5 39-2 29-2 21-6 27-3 1871 ... 13,385 20-6 25-3 18-9 17-2 19-7 19-6 20-6 28-L 26-7 24-1 23-3 19-8 22-0 1872 ... 13,512 15-7 16-7 19-9 20-0 10-9 21-4 22-5 37-3 42-2 47-1 40-8 33-4 28-3 1873 ... 13,863 32-6 33-1 35-4 33-9 31-0 28-5 25-4 361 60-1 62-5 44-0 35-3 38-5 187i ... 14,619 33-2 297 29-1 29-8 30-9 30-4 26-3 31-1 38-8 52-3 50-2 291 34-3 187.'; ... 14,347 29-5 28-2 28-5 30-6 32-0 318 28-2 43-4 46-8 48-1 44-4 38-5 36-0 1876 ... 13,479 33-5 27-8 26-3 38-8 42-7 46-4 38-1 60-6 72-5 69-6 SB-6 45-6 46-5 1867—76 ... 129,933 25-7 25-3 25-4 27-3 27-9 20-9 24-6 343 43-8 47-6 41-9 30-4 31-9 II.—ADMISSION-RATE FROM ALL CAUSES IN EACH MONTH OP THE PERIOD. Admitted ib-to Hospit.vl pee 1,000 of thu Avbb.igb SiEEifGTK vs each Mouth. Admission- YEAR. rate of tile Jan. Feb. .March. Apri). May. June. July. Aucr. Sept. Oct. Nov. Dec. year. 1867 ... 43-7 40-3 62-3 86-0 67-1 72-6 82-1 88-9 194-8 1.39-S 88-2 58-0 1028-1 1868 ... 51-5 46-9 50-3 60-6 67-2 6S-3 62-5 73-5 66-9 98-1 91-6 .57-9 790-1 1869 ... 43-7 54-5 77-0 67-2 61-2 67-0 63-8 125-4 138-0 223-0 155'5 74-3 1156-6 1870 ... , 80-7 73-5 61-8 69-8 77-2 71-0 79-7 110-5 147-6 141-6 84-4 59-7 1072-1 1871 ... 55-5 55-5 54-1 ,53-3 63-5 60-5 81-9 112-9 00-6 73-0 69-2 47-5 825-7 1872 ... 41-0 44-8 fiO'o 65-6 67-0 67-2 83-2 150-2 184-8 159-8 127-5 104-3 1166-1 1873 ... 103-2 81-1 8I-3 82-0 96-0 95-3 81-9 143-9 198-9 178-2 112-5 89-8 1360-7 1874 ... 71-2 57-6 70-3 78-8 88-8 72-9 74-6 114-8 128-1 163-1 99-8 73-4 1096-7 1875 ... ... 68-9 59-2 69-8 68-1 89-6 91-6 79-3 l'29-O 157-1 164-5 140-8 110-0 1234-0 1876 ... 83-4 59-6 76-4 112-3 129-7 114-8 105-2 213-6 270-0 233 2 160-3 116-6 1677-0 1867—75 .. 85-1 57-6 67-1 74-5 81-8 78-5 79-9 12S-3 158-7 1.58-5 113-1 79-8 1151-2 IIL—COMPOSITION OP THE ADMISSION-RATE OP EACH YEAR. Admitted into Hospital pbe 1,000 OF THE AvEEiGB SteBNGTH IN E.ACH Y'EAE. YEAR. 0 s, s 0 i'i 0 0 b 0 < d g fi w 5 c 0 Phthisis Pul- moualis. P. p Q < in g rt c a p g w Wounds and Auciuents. 0 6 J Admission- rate of the year. 1867 ... 1868 ... 1869 ... 1870 ... 1871 ... 1872 ... 1873 ... 1874 ... 1875 ... 1876 ... 7-2 3-5 '6-7 3-1 2-2 28-2 80-4 12-9 14-9 75-7 33-9 586-2 367-8 700-2 660-1 447-2 693-8 729-5 681-2 703-2 1107-7 1-6 1-1 1-8 -8 3-0 •9 1-3 1- 3 2- 0 2-4 105-5 Ks-1 94-1 115-2 87-5 143-7 149- 0 82-4 139-2 150- 2 1-1 1-1 -3 -6 -5 1-4 ■6 -9 -6 -2 14-4 5-9 4- 8 5- 9 7- 2 6- 5 9-8 98 9-8 8- 4 28- 0 29- 1 21-5 58- 1 39-1 53-0 85-5 77-8 56-7 59- 6 11 1-0 1- 4 2- 1 1-8 1-9 1- 7 2- 5 1-8 26 1-0 -0 ■9 -9 1-3 -9 1- 7 2- 6 1-5 1-3 4-9 7- 8 6-1 3- 6 4- 2 8- 0 12-9 6-2 6-6 12-8 8-1 6-5 3-7 2-0 1- 3 2- 1 -8 1-0 1-0 -5 15- 7 17-3 14-1 14-2 11-2 130 16- 5 10-5 13-8 16-0 14- 9 22-0 17- 5 16-1 13-4 13-5 18- 1 12-7 15- 5 12-1 92-3 110-4 88- 6 76-3 80-4 89- 3 116-4 109-0 130-1 192-3 22-4 33-5 28-3 24-5 27- 7 26-6 31-9 38- 0 39- 1, 28- 3 95-5 97-8 89-1 91-7 87-0 89-3 109-3 120-9 105-0 80-4 1028-1 790-1 n.56-6 1072-1 825-7 1166-1 1360-7 . 1096-7 1234-0 1677-0 1867—70 2-2 24-3 665-4 1-6 116-4 -7 8-2 52-4 1-9 1-3 7-4 2-5 14-8 15-5 109-4 30-2 97-0 1151-2 IV.—DEATH-RATE OP EACH YEAR, AND ITS GENERAL COMPOSITION. Annual Death-eate per 1,000 OP Steength. Died pee 1,000 feom thb dipfeebnt Causes op Moetality. YEAR. A Cholera. B All other Causes. C All Causes. c3 -3 .a Contagious Fe- vers. Other Fevers. 0 < £ § S 53 0 .-.^ a Hepatitis. Spleen Disease. Respiratory Die- eases. Heart Disease, j Plithisis Pul- monalis. Dropsy. P c3 >^'p -g,| All other Causes. Violent Deaths. 1 1867 3-90 20-76 24-66 3-90 2-95 4-47 1-05 5-62 ■19 •10 2-85 •48 •38 •10 -57 1-81 -19 J 868 12-39 12-39 299 -36 3-O8 •27 2-08 •18 -72 -63 1-63 -45 1869 i-78 31-58 33-36 1-78 7-11 7-43 -81 7-43 '■24 •16 3-88 •08 •81 '•'43 -57 2-26 •32 1870 35-98 35-98 11-73 ■39 8-14 •24 •]6 9-85* •86 •31 -86 2-82 -63 1871 27-19 27-19 3-59 3-96 ■95 6-72 •08 •37 6-98 '-08 •82 •37 -75 2-62 •90 J 872 3-03 31-46 34-49 3-03 2-81 5-11 ■30 10-36 ■23 7-3.3t •22 1-04 •37 -81 2-22 ■67 1873 48-76 48-76 10-75 7-64 1-OS 7-67 •07 '■'29 11-21 •36 •94 •14 1-30 3-61 •SO 1874 i-46 32-08 32-08 2-53 4-17 -27 5-88 ■14 -14 in-81 •21 ■96 -34 -89 6-1.3t •61 1875 30-25 31-71 1-46 7-53 ■77 7-53 •07 -35 7-81 •42 •84 •28 -66 2-86 1-25 1876 1-04 35-61 36-65 1-04 5-41 ■81 14-39 -08 8-33 •Q8 1-26 •37 1-26 2-68 -89 1867—76 ... 1-07 31-20 32-27 1-07 2-96 6-14 ■68 7-79 •12 -19 7-59 -21 •88 ■29 -83 2-83 -69 Pneumonia, apparently contagious, in several jails. t Erysipelatous sorc-throut in several Jails,](https://iiif.wellcomecollection.org/image/b24749333_0245.jp2/full/800%2C/0/default.jpg)