Reports bringing up the statistical history of the European Army in India and of the Native Army and jail population of Bengal to 1876 : and the cholera history of 1875 and 1876, in continuation of reports embracing the period from 1817 to 1872 / by J.L.Bryden.
- James Bryden
- Date:
- 1878
Licence: Public Domain Mark
Credit: Reports bringing up the statistical history of the European Army in India and of the Native Army and jail population of Bengal to 1876 : and the cholera history of 1875 and 1876, in continuation of reports embracing the period from 1817 to 1872 / by J.L.Bryden. Source: Wellcome Collection.
Provider: This material has been provided by Royal College of Physicians, London. The original may be consulted at Royal College of Physicians, London.
253/358 (page 233)
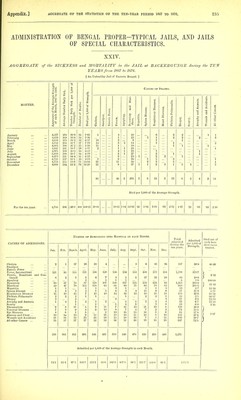
![ADMINISTRATION OF BENGAL PROPER-TYPICAL JAILS, AND JAILS OF SPECIAL CHARACTERISTICS. XXII. AGGREGATE of SICKNESS and MORTALITY in the PRESIDENCY JAIL duTing the SIX YEARS from 1871 to 1876. [Previous to 1871, the statistics of this Jail were not incorporated in the General Return, and the figures are therefore given for the last six years only.] MONTHS. ■ e r a g e th 1871-76. o r 1,000 Causes op Dbaths. ggi-egate of the A v Strength of each Mon verage Number Daily 1 umber Daily Sick pe Strength. umber of Deaths. ied per 1,000 of Streng holera. mallpox. (> poplexy. ysentery and Diarrhcea. epatitis. pleen Disease. espiratory Diseases. eart Diseases. ithisis Pulmonalis. p a s a < a rt >-» .a 0. p ounds and Accidents. 11 other Causes. o CO < a a D-( Q < < 5,677 235 41-4 16 2-82 2 7 4 1 6,7.1fi 198 34-5 15 2-61 l 1 6 2 1 '4 5,670 216 38-1 13 2-29 5 6 1 1 5,629 226 40-1 10 178 1 1 3 '2 1 5,66^t 203 35-8 13 2-29 1 2 3 7 5,693 172 30-2 8 1-41 1 3 2 '2 5,695 2-13 42-7 16 2-81 9 1 2 3 1 5,626 253 45-0 9 1-60 1 1 i 1 3 2 5,780 270 46-7 9 1-56 i 2 2 1 1 '2 5,902 302 51-2 12 2-03 2 1 i 2 2 1 2 1 5,924 283 47-8 13 2-19 1 6 3 3 5,191 245 41.-6 15 2-73 6 1 5 1 2 20 1 9 i 43 17 i 32 3 5 11 Died per 1,000 of the Average Strength. 5,708 237 41-S 149 20-10 3-50 -17 1-58 ■70 7-53 2-98 -70 5-01 •52 •88 193 .January February March April May June July Au^'ust September October November December For; the six years NuMBEE OP Admissions into Hospital in BACH Month. Total CAUSES OF ADMISSIONS. admitted Admitted during the per 1,000 of six years. Strength. Jan. Feb. March. April. May. June. July. Aug. Sept. Oct. 1 Nov. Dee. Cholera ... 1 13 1 2 2 14 1 4 1 39 6-8 -5 Smallpox 1 1 1 3 Enteric Fever (1872—76) Fever, Intermittent Fevers, Remittent and Con- 329 238 333 311 328 218 308 373 396 695 620 390 4,339 ^60-2 tinued... 3 4 22 18 20 15 27 59 92 100 55 19 434 70 0 Apoplexy 1 2 1 1 1 0 1-1 Dysentery 122 118 114 no 90 77 107 103 101 140 153 UG 1,507 264-0 Diarrhoea 224 276 474 412 202 258 327 234 221 342 225 207 3,402 606-5 Hepatitis .. 1 1 1 3 -5 Spleen Disease 8 8 1 3 13 3 3 ' 8 21 8 9 7 92 16-1 35-0 15-0 1-1 Respiratory Diseases 21 15 16 10 13 11 18 12 15 29 24 16 200 Phthisis Pulmonalis 6 4 10 7 9 7 5 6 5 10 9 11 89 Dropsy ... 2 1 1 2 6 Atrophy and Anaimia 10 11 8 12 9 8 lIXl 39 45 23 15 20 300 52-6 -4 31-0 56-1 28-2 192-9 90-7 232-1 Scurvy ... 2 2 Rlieumatism 16 '9 15 12 9 15 21 30 8 17 10 15 177 Venereal Diseases ... 22 17 28 35 28 30 25 21 24 22 33 35 320 Eye Diseases 10 6 5 16 13 13 19 15 20 21 10 13 101 Abscess and Ulcer ... 82 82 90 119 109 109 110 95 71 70 77 78 1,101 Wounds and Accidents 16 29 34 49 45 51 40 47 65 46 43 47 .518 All other Causes 198 181 102 111 103 84 82 94 103 73 81 113 1,325 1,070 1,000 1,205 1,233 1,050 904 1,221 1,197 1,250 1,530 1,207 1,118 14,084 Admitted per 1,000 of^the Average Strength in each Month. 188-5 174-0 223 1 219-0 186-4 158-8 214-4 212-8 216-3 254-7 213-7 2467^4 3l](https://iiif.wellcomecollection.org/image/b24749333_0255.jp2/full/800%2C/0/default.jpg)