Reports bringing up the statistical history of the European Army in India and of the Native Army and jail population of Bengal to 1876 : and the cholera history of 1875 and 1876, in continuation of reports embracing the period from 1817 to 1872 / by J.L.Bryden.
- James Bryden
- Date:
- 1878
Licence: Public Domain Mark
Credit: Reports bringing up the statistical history of the European Army in India and of the Native Army and jail population of Bengal to 1876 : and the cholera history of 1875 and 1876, in continuation of reports embracing the period from 1817 to 1872 / by J.L.Bryden. Source: Wellcome Collection.
Provider: This material has been provided by Royal College of Physicians, London. The original may be consulted at Royal College of Physicians, London.
255/358 (page 235)
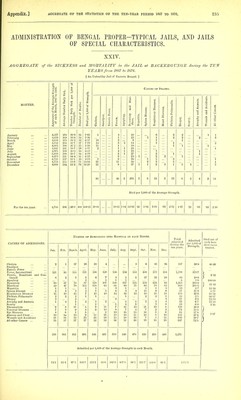
![ADMINISTRATION OF BENGAL PEOPER-TYPICAL JAILS, AND JAILS OF SPECIAL CHARACTERISTICS. XXIV. AGGREGATE of the SICKNESS and MORTALITY in the JAIL at BACKERGUNGE during the TEN YEARS from 1867 to 1876. [ An Unhealthy Jail of Eastern Bcnjjal. ] o tj) . o o Causes ov Deaths. o f o 'lie to >^ ft ci a 'c5 P 3 s !2 MONTHS < £ a> O -a 1 o o ^ tr g & o Average Numb Number Daily Strength. Number of De; Died per 1,000 Cholera. Smallpox. Enteric Fever. Fevers. Apoplexy. a C3 1 1 Hepatitis. Spleen Disease, Bespiratory Di Heart Diseases Phthisis Pulmc 0 (5 Scurvy. Atrophy and A Wounds and A All other Causi January 4,577 178 38-9 35 7-65 1 4 18 6 2 2 1 1 Feljruary 4,619 169 360 34 7-36 1 22 'l 1 2 2 2 0 JIareh 4,656 178 38-2 32 6-87 19 2 9 1 1 April 4,752 203 42-7 37 7-79 14 3 2 14 1 1 May June 4,805 198 41-2 25 5-20 11 1 10 1 1 1 4,941 191 38-7 29 5-87 2 1 i 24 i July 4,971 199 40-0 30 6-03 4 1 23 l 1 August 5,009 199 39-7 34 6-79 2 1 27 2 1 1 September 4,973 221 44-.1 31 6'23 2 23 . i 2 '1 October 4,728 237 50-1 40 9-73 2 9 26 l S 2 i NoTember 4,753 255 53'6 71 14-94 21 11 30 2 3 3 1 December 4,669 2-41 52-3 76 16-28 21 8 37 1 1 2 1 1 1 1 91 48 5 263 2 5 24 3 13 8 1 4 2 11 Died per 1,000 of the Average Strength. For the ten years 4,788 206 1143-0 480 100-25 19-01 10-02 1-04 54-93 -42 1-04 5-01 -63 2-72 1-67 •21 •83 •42 2-30 CAUSES OF ADMISSIONS. / - NuiIBBR OP ADMISSIO^■S INTO HOSPITAL IN EACH MONTH. Total admitted during the ten years. Admitted per 1,000 of Strength. Died out of each hun- dred cases treated. Jan. Feb. March. April. May. June. July. Aug. Sept. Oct. Nov. Dec. Cholera 1 37 25 29 4 3 6 43 36 187 39-0 48-68 Smallpox Enteric Fever Fever, Intermittent i2i 95 155 121 136 126 186 219 154 200 172 114 1^799 375-7 Fevers, Eemittent and Con- 1 2.55 tinued 8 2 1 5 6 7 8 1 5 17 16 10 80 18-0 Apoplexy 2 1 1 1 5 1-0 100-00 Dysentery 08 57 70 87 i'28 107 140 127 125 133 123 93 1,261 264-0 Diarrhcea 50 47 78 155 138 65 61 68 71 66 78 83 960 200-5 } 11-83 Hepatitis 1 1 1 1 3 1 1 1 3 13 2-7 15-38 Spleen Disease 5 3 1 3 1 5 6 3 4 11 9 6 57 11-9 S-77 Bespiratory Diseases 15 10 15 7 13 10 14 16 13 10 15 18 150 32-6 15-38 Phthisis Pulmonalis 2 2 1 1 1 2 3 1 15 3-1 86-37 Dropsy 3 2 4 11 2-3 72-73 Atrophy and Anasmiii 1 '4 i 2 3 2 5 5 3 4 32 6-7 12-50 Scurvy 1 2 1 4 9 3 9 29 6-0 3-45 Eheumatism e 8 11 5 9 11 7 11 13 21 19 8 129 26-9 Venereal Diseases ... 7 3 9 4 9 10 9 7 4 7 2 3 74 15-5 Eye Diseases 4 0 1 5 2 10 15 15 16 5 6 85 17-8 Abscess and Ulcer ... 10 10 13 9 12 16 13 10 11 10 8 10 132 27-6 1 1-67 Wounds and Accidents 21 16 12 23 24 24 13 20 16 7 3 11 190 39-7 All other Causes ... 15 37 37 37 32 33 36 31 30 19 15 25 347 72-0 339 302 452 493 5« 423 510 540 478 528 518 444 5,571 Admitted per 1,000 of the Average Strength in each Month. 74-1 65-4 071 103-7 113-2 85-6 102-6 107-8 96-1 111-7 lo9-0 95-1 111 3-5](https://iiif.wellcomecollection.org/image/b24749333_0257.jp2/full/800%2C/0/default.jpg)