Reports bringing up the statistical history of the European Army in India and of the Native Army and jail population of Bengal to 1876 : and the cholera history of 1875 and 1876, in continuation of reports embracing the period from 1817 to 1872 / by J.L.Bryden.
- James Bryden
- Date:
- 1878
Licence: Public Domain Mark
Credit: Reports bringing up the statistical history of the European Army in India and of the Native Army and jail population of Bengal to 1876 : and the cholera history of 1875 and 1876, in continuation of reports embracing the period from 1817 to 1872 / by J.L.Bryden. Source: Wellcome Collection.
Provider: This material has been provided by Royal College of Physicians, London. The original may be consulted at Royal College of Physicians, London.
256/358 (page 236)
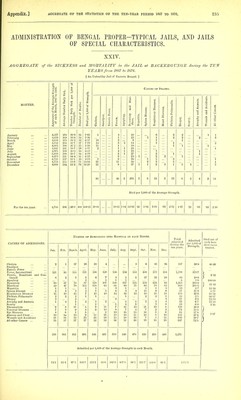
![ADMINISTRATION OF BENGAL PROPER-TYPICAL JAILS, AND JAILS OF SPECIAL CHARACTERISTICS. XXV. AaGREGATE of the SICKNESS and MOBTALITY in the JAIL at BAJSHAHAIduring the TEN YEARS from 1867 to 1876. [ A Healthy Jail of Northern Bengal, ] o o o Causes OP Deaths o ^' QJ O CO verag 1867 Daily o< M Stren 5 0 -BIttI lonts. MONTHS. teot the A h Month, Number : ■ Daily Si 5th. of Deatbi r 1,000 of 1 M Fever. >-> ■a a 3 Scry Disea ; Pulmoiia 8 3 <! c rt and Aceit r Causes. rt ^ be a V 60 3 a c. u Q> 0 _& M g 8 S cd (3 > >» .c ■3 u, > a 3 t3 o J3 rt a a > -p. 0 P, 0. 'ft u 3 0 0 0 < < P CD < tS m M a Oh 0 03 January 6,243 156 25-0 21 3-36 2 8 2 1 2 1 4 1 February 6,285 135 21-5 18 2'86 i 4 1 2 2 6 '2 March 6,402 142 22'2 24 3-75 3 2 4 2 4 '2 1 4 2 April 6,639 161 24-3 60 9-04 43 3 1 5 1 2 i 2 1 1 May 1 6,698 1-14 21-5 27 4-03 13 4 1 3 1 1 1 3 June 6,772 151 22-3 23 3-40 3 2 4 5 4 2 2 1 July 6,887 167 24-2 11 1-60 2 2 2 1 1 3 August 7,007 201 23-7 22 314 i 3 i 8 4 3 2 September 6,993 164 235 16 2-29 1 2 10 1 1 I October 6,810 175 25-7 29 426 2 1 11 1 4 3 1 2 1 3 November 6,810 197 28-9 M) 5-87 6 3 18 2 1 3 6 1 December 6,709 179 26-7 29 4-32 1 3 17 2 3 1 2 71 1 26 6 94 9 26 4 17 14 1 35 3 13 Died per 1 000 of the Average Stren ?th. For the ten years 6,688 164 24-5 320 47-85 10-62 •15 3-89 -90 14-05 1-35 3-89 •60 2^54 2^09 •15 5-23 *45 1-94 CAUSES OP ADMISSIONS. NUMBEE OP AdMISSIOITS INTO HOSPITAL IN BACH MorriH. Total admitted during the ten years. Admitted per 1,000 of Strength. Died out of each hun- dred caseM treated. Jan. Feb. March. April. May. June. July. Aug. Sept. Oct. Nov. Dec. Cholera 10 91 21 6 1 2 9 3 143 21 4 49 65 Smallpox 1 1 1 Enteric Fever 1 1 2 3 50 00 Fever, Intermittent 97 77 113 138 115 110 160 186 125 165 193 133 1,612 241 0 Fevers, Remittent and Con- 56 tinued 3 3 3 5 3 2 6 6 3 9 6 4 53 7 9 Apoplexy 1 2 1 1 1 2 8 1 2 75 00 Dysentery 47 33 '47 63 45 45 68 105 67 65 81 64 730 109 2 Diarrhffia 21 33 82 41 19 17 27 51 45 33 72 28 469 70 1 1 ^ 84 Hepatitis 1 1 ... 1 1 4 6 Spleen Disease 7 6 5 3 8 6 10 11 6 3 io 6 81 12 1 u 11 Kespiratory Diseases 7 7 7 16 7 9 6 7 13 14 11 12 116 17 3 22 41 Phthisis Pnlmonalis 1 1 1 3 4 5 2 2 1 2 6 4 32 4 8 53 12 Dropsy 8 4 3 5 6 7 1 2 5 4 2 1 48 7 2 29 17 Atrophy and Aneemia 10 13 15 16 16 16 17 17 14 13 14 16 177 26 5 19 77 Scurvy 1 1 1 1 4 6 25 00 Rheumatism 5 4 3 3 3 3 1 3 6 6 2 39 5 8 • Venereal Diseases ... 2 2 2 ) 5 2 2 2 1 4 1 24 3 6 Eye Diseases 3 5 5 6 5 5 8 2 ? 4 53 7 8 3 34 Abscess and Ulcer ... 17 22 14 15 13 7 21 13 9 13 12 163 24 4 Wounds and Accidents 10 5 9 7 6 10 5 9 6 7 9 6 89 13 3 All other Causes ... 31 20 14 11 19 15 9 19 13 23 19 39 232 34 7 270 229 333 424 296 266 344 439 322 362 457 335 4,079 Admitted per 1,000 of the Average Strength in each Month. 43-2 36-4 523 639 44-2 39-3 60-0 62-7 46-0 53-2 671 49-9 609-9](https://iiif.wellcomecollection.org/image/b24749333_0258.jp2/full/800%2C/0/default.jpg)