Reports bringing up the statistical history of the European Army in India and of the Native Army and jail population of Bengal to 1876 : and the cholera history of 1875 and 1876, in continuation of reports embracing the period from 1817 to 1872 / by J.L.Bryden.
- James Bryden
- Date:
- 1878
Licence: Public Domain Mark
Credit: Reports bringing up the statistical history of the European Army in India and of the Native Army and jail population of Bengal to 1876 : and the cholera history of 1875 and 1876, in continuation of reports embracing the period from 1817 to 1872 / by J.L.Bryden. Source: Wellcome Collection.
Provider: This material has been provided by Royal College of Physicians, London. The original may be consulted at Royal College of Physicians, London.
257/358 (page 237)
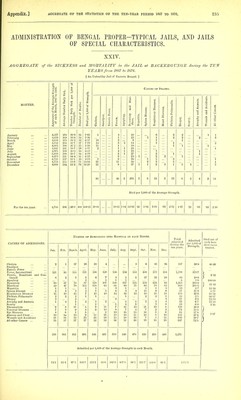
![ADMINISTRATION OF BENGAL PROPER-TYPICAL JAILS, AND JAILS OF SPECIAL CHARACTERISTICS. XXVI. AGGREGATE of the SICKNESS and MORTALITY of the JAIL at RUNGPORE during the TEN YEARS from 1867 to 1876. [An Unhealtliy Jail of Northern Bengal.] o § o o Causes op Deaths. CQ CD o cc 2 o o ca c a MONTHS. <t, ^ o o ^ p ^ verage Number Dail; umber Daily Sick Strength. umber of Deaths. ied per 1,000 of Strc holera. o _g. a ntcric Fever. > poplexy. « a £■ hepatitis. pleen Disease. espiratory Diseases. icart Diseases. hthisis Pulmonalis. ropsy. > 3 trophy and Antemia ''ounds and Accident U other Causes. < « OS <1 P CO M CM D < < January .3,876 186 48-0 51 13-93 2 28 1 1 8 10 1 February 3,908 168 43-0 31 870 1 11 i 1 G 3 7 2 March - 3,879 178 45-9 37 9-54 1 4 14 3 5 5 1 1 April 3,819 180 47-1 55 14-40 3 G 20 1 o 13 4 2 1 '3 Jlay 3,843 211 65-7 56 14-.57 19 15 13 3 2 1 1 June 3,835 213 55-5 31 8-87 12 2 i 9 4 3 July 3,906 201 52-2 32 8-19 15 1 3 G 1 4 2 August 3,971 210 52-8 34 8-56 2 14 8 2 5 3 September 3,857 205 63-2 26 G-71 1 14 2 4 3 i 1 October 3,853 209 64-3 41 10-01 2 20 3 2 4 G 2 November •3,863 203 52-5 46 11-91 4 20 2 i 7 0 2 2 December 4,015 193 48-1 48 1196 1 23 i 3 3 G 8 3 23 23 2 206 2 11 20 3 87 56 33 21 Died per 1 ,000 of the Avcra ?e Strength. For tlie ten years 3,880 197 60-7 497 127-89 6-92 5-93 -51 53-01 -61 3-00 5-15 -77 22-39 11-11 8-49 1-80 6-41 NUMBEE OP Admissions into Hospital in bach Month. Total admitted CAUSES OP ADMISSIONS. Admitted per 1,000 of Strength. Died out of each hundred cases treated. Jan. Feb. Mar. April. May. June. July. Aug. Sept. Oct. Nov. Dec. during the ten years. Cholera Smallpox Enteric Fever Fever, Intermittent Feverc), Eemittent aud Con- tinued Apoplexy Dysentery Diarrhoea Hepatitis Spleen Disease ... Respiratory Diseases Phthisis Pulmonalis Dropsy Atrophy and Anemia Scurvy Rheumatism Venereal Diseases Fye Diseases Abscess and Ulcer Wounds and Accidents All other Causes ... 1 117 18 74 28 1 15 15 19 37 7 7 7 17 4 33 113 17 09 19 '5 19 3 23 9 5 4 1 29 12 21 3 105 21 91 35 '2 28 10 39 10 G 3 1 30 14 20 4 78 17 129 GO 16 18 21 23 11 5 3 2 17 15 10 54 81 14 95 70 1 G 13 14 35 21 G 2 3 18 20 11 86 7 95 48 12 7 12 40 11 1 .5 4 1 21 15 17 1 io5 8 98 42 28 10 14 28 15 '4 5 1 30 16 11 1 185 3 100 33 10 11 9 32 11 3 9 3 27 8 22 173 17 01 23 is 5 25 9 r. 4 1 29 6 14 1 189 13 2 115 19 17 16 13 28 7 '4 4 4 21 10 16 173 17 i'20 30 1 7 11 7 28 4 '1 5 3 22 10 14 170 14 '98 49 3 9 13 10 47 8 '1 5 2 21 11 8 C5 i,'575 105 2 1,181 172 G 148 165 133 385 126 1 58 55 282 141 206 10-7 405-3 42- 5 •5 304-7 121-5 1-5 38-1 43- 5 34-3 99-1 32-4 -3 14-9 14-1 5-G 72-G 30-3 63-0 35-38 100-flO 1 12-44 -33-33 9-46 12-13 65-41 14-55 26-19 1 4-06 400 349 418 Ml 407 382 419 484 427 470 456 472 5,101 Admitted per 1,000 of the Average Igtrength in each Month. 103-2 89-3 107-8 116-5 121-5 99-6 107-3 121-8 110-7 123-6 118-0 117-0 1335-8](https://iiif.wellcomecollection.org/image/b24749333_0259.jp2/full/800%2C/0/default.jpg)