Reports bringing up the statistical history of the European Army in India and of the Native Army and jail population of Bengal to 1876 : and the cholera history of 1875 and 1876, in continuation of reports embracing the period from 1817 to 1872 / by J.L.Bryden.
- James Bryden
- Date:
- 1878
Licence: Public Domain Mark
Credit: Reports bringing up the statistical history of the European Army in India and of the Native Army and jail population of Bengal to 1876 : and the cholera history of 1875 and 1876, in continuation of reports embracing the period from 1817 to 1872 / by J.L.Bryden. Source: Wellcome Collection.
Provider: This material has been provided by Royal College of Physicians, London. The original may be consulted at Royal College of Physicians, London.
259/358 (page 239)
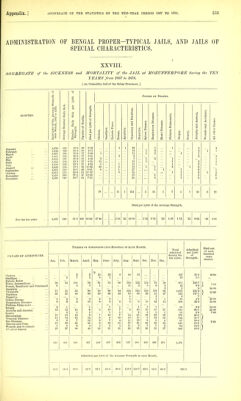
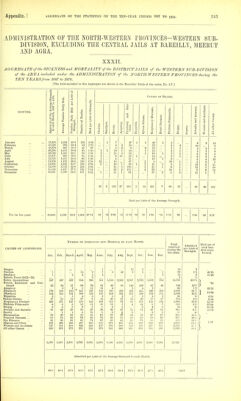
![ADMINISTRATION OF BENGAL PROPER-TYPICAL JAILS, AND JAILS OF SPECIAL CHARACTERISTICS. t XXVIII. AGGREGATE of the SICKNESS and MORTALITY of the JAIL at MOZUFFERPORE during the TEN TEARS from 1867 to 1876. [ An Unhealthy Jail of the Behar Provinces. ] S 1,000 of Causes op Deaths. a. to ci a MONTHS. the Avei , 1867 to : '3 O % ily Sick 0 of Strei id Diarrhi S monalis. a » a < Accident te of oiith B Q . 0 M Fcve R 0 iseas 3 and -3 a a O — Average .s g a Died per Cholera. Smallpo Enteric Fevers. Apoplex 2 >^ fi Hepatiti Spleen 1 Respiral Heart D Phthisis Dropsy. Scurvy. Atrophy Wounds All othc January February March April May June July August September October November 4,230 121 28-6 29 cae 1 1 22 1 1 1 i 4,242 120 28'3 20 4-71 13 1 2 2 1 1 4,363 138 31-6 17 3-89 i 11 1 2 1 1 4,461 138 30-9 17 3-81 3 9 2 .3 4,602 127 27-6 21 4-56 '9 7 1 '2 1 1 4,454 104 23-3 37 8-31 15 15 1 1 '2 3 4,560 102 22-4 21 4-62 5 i 11 1 2 1 4,609 156 .33-8 86 18-66 40 2 33 1 1 2 1 C 4,672 4,615 130 178 38-5 386 46 55 9-85 11-92 8 1 3 27 -45 1 1 1 1 1 6 2 1 1 2 4,410 163 37-0 47 10-66 33 2 1 5 6 December 4,566 140 30-7 34 7-45 25 4 1 2 2 78 11 1 251 5 15 1 7 5 1 31 2 22 For the ten years Died per 1,000 of the Average Strength. 4,482 139 31-0 430 95-94 17-40 2-45 •22 56-00 1-12 3-35 •22 1-56 1-12 ■22 6-92 •45 4-91 NuMBEE OF Admission s INTO Hospital in each Month. Total admitted Admitted per 1,000 Died out of each hundred cases treated. CAUoES OF ADMISSIONS. Jan. Feb. March. April. May. June. July. Aug. Sept. Oct. Nov. Dec. during the ten years. of Strength. Cholera ... Smallpox ... Enteric Fever Fever, Intermittent ... Fevers, Remittent and Continued Apoplexy ... Dysentery Diarrhoea ... Hepatitis ... Spleen Disease Respiratory Diseases... Phthisis Pulmonalis ... Dropsy Atrophy and Ansemia Scurvy Rheumatism Venereal Diseases Eye Diseases Abscess and Ulcer Wounds and Accidents All other Causes 39 6 71 31 '1 8 2 12 is 11 5 13 8 23 2 52 36 29 '2 9 1 12 2 13 14 6 29 8 27 3 7 108 3 54 40 '3 9 n 1 13 15 7 25 6 40 2 5 99 3 es GO '4 10 1 c 1 9 14 12 16 4 48 23 8 61 1 58 66 2 9 6 6 3 9 3 35 23 1 75 38 60 3 3 1 10 1 12 8 7 IB •> 31 8 so 84 43 s '1 7 1 7 10 4 15 4 31 86 io8 11 134. 70 1 1 3 '9 14 11) 11 17 11 20 13 122 2 lot 63 6 1 20 2 25 15 13 25 2 35 112 8 154 29 10 15 3 22 8 9 22 7 28 75 G 131 15 2 1 12 1 11 1 23 13 5 32 7 31 40 3 2 90 27 1 13 17 1 16 12 5 22 2 27 157 23 ' 971 43 2 1,081 625 3 18 100 10 135 13 179 142 87 240 64 382 35-0 51 216-7 9-G •4 241-2 1171 -7 4-0 22-3 2-2 30- 1 2-9 40-0 31- 7 19-4 53-6 14-3 85-2 49- 68 } 1-08 50- 00 \ 15-63 27-78 15-00 50-00 22-96 7-69 1 2-29 248 241 345 367 286 287 303 517 608 429 306 278 4,175 Admitted per 1,000 of '>he Average Strength in each Month. •58-6 56-8 79-0 82-3 62-1 64-4 66-6 112-2 108-7 03-0 83-0 609 931-5](https://iiif.wellcomecollection.org/image/b24749333_0261.jp2/full/800%2C/0/default.jpg)